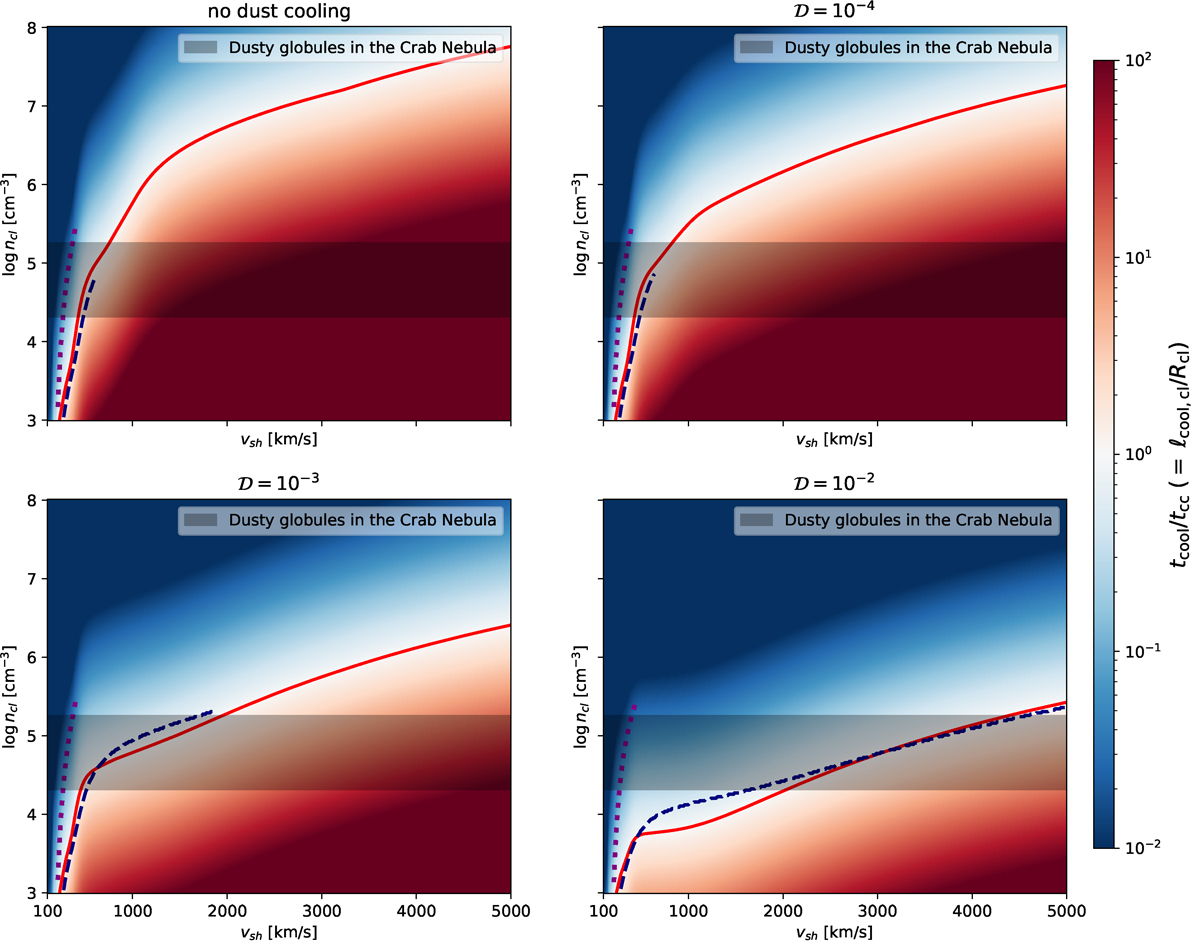
Fig. 2.
Download original image
Regimes of clump survival versus crushing for clumps with Rcl = 500 AU. The maps show tcool/tcc as a function of shock velocity and clump density. The panels correspond to cases with metal-line cooling only (top left), and different dust-to-gas mass ratios: 𝒟 = 10−4 (top right), 𝒟 = 10−3 (bottom left), and 𝒟 = 10−2 (bottom right). The solid red lines mark tcool = tcc. Clumps above the line (lower vsh or higher ncl) can cool or grow, while below the line they are crushed. Higher dust-to-gas mass ratios expand the survival region. Dashed blue: Isobaric ℛ = 1. Dotted purple: Isochoric ℛ = 1. Isochoric crossings occur only at vsh ≲ a few 102 km s−1; realistic clumps fall between these limits. In both cases, regions above the ℛ = 1 lines correspond to grain growth exceeding thermal sputtering. The hatched area indicates the range of observed dusty globules in the Crab Nebula.
Current usage metrics show cumulative count of Article Views (full-text article views including HTML views, PDF and ePub downloads, according to the available data) and Abstracts Views on Vision4Press platform.
Data correspond to usage on the plateform after 2015. The current usage metrics is available 48-96 hours after online publication and is updated daily on week days.
Initial download of the metrics may take a while.