| Issue |
A&A
Volume 702, October 2025
|
|
|---|---|---|
| Article Number | L6 | |
| Number of page(s) | 4 | |
| Section | Letters to the Editor | |
| DOI | https://doi.org/10.1051/0004-6361/202556389 | |
| Published online | 07 October 2025 | |
Letter to the Editor
Dusty clump survival in supernova ejecta
Dust-mediated growth versus crushing by the reverse shock
Instituto Nacional de Astrofísica, Óptica y Electrónica, AP 51, 72000 Puebla, Mexico
⋆ Corresponding author: This email address is being protected from spambots. You need JavaScript enabled to view it.
Received:
13
July
2025
Accepted:
7
September
2025
Abstract
Context. Understanding the interaction of dense, cold ejecta clumps with a fast reverse shock, an instance of the “cloud-crushing” problem, is essential to assess whether core-collapse supernovae act as net dust factories or net dust destroyers.
Aims. This work assesses whether dusty ejecta clumps are destroyed by the reverse shock or instead cool, condense, and grow in mass under realistic supernova-remnant conditions.
Methods. Cloud-crushing timescales were computed and compared to radiative cooling timescales, including both gas-phase cooling and dust-induced cooling, for a large grid of clump densities, dust-to-gas mass ratios, and shock velocities.
Results. When the dust-to-gas mass ratio exceeds 10−3, gas–grain collisions become efficient enough that the cooling timescale, tcool, falls below the cloud-crushing timescale, tcc, over a broad span of clump densities and shock velocities, enabling dusty clumps to survive even fast reverse shocks. For example, at clump densities of ≳2 × 104 cm−3, dust-to-gas mass ratios of ∼10−2, and shock velocities of up to 2000 km s−1, enhanced gas–grain cooling drives the system into a regime in which dusty clumps can gain additional cold mass and increase their dust masses.
Conclusions. Strong radiative cooling can shield dust-rich clumps in supernova remnants, enabling a significant fraction of ejecta dust to be injected into the interstellar medium. These results mirror the “growth” regime found in studies of circumgalactic clouds and rapidly cooling shocked stellar winds, implying a larger dust survival in supernova remnants. Indeed, the dusty globules seen in the Crab Nebula occupy the predicted survival regime across a wide range of physical parameters.
Key words: hydrodynamics / dust, extinction / ISM: supernova remnants
Publisher note: the bibliography displayed in the HTML version was incorrect. It was replaced with the correct reference list on October 24, 2025.
© The Authors 2025
 Open Access article, published by EDP Sciences, under the terms of the Creative Commons Attribution License (https://creativecommons.org/licenses/by/4.0), which permits unrestricted use, distribution, and reproduction in any medium, provided the original work is properly cited.
This article is published in open access under the Subscribe to Open model. This email address is being protected from spambots. You need JavaScript enabled to view it. to support open access publication.
1. Introduction
The interaction of a dense, cold clump of gas with a hot shocked flow (the “cloud-crushing problem”) has been extensively studied in the context of supernova remnants (SNRs), where dense clumps of ejecta (and any dust they contain) can be hit by the reverse shock. Hydrodynamic simulations by Silvia et al. (2010, 2012) examined dust sputtering in idealized clumpy ejecta. They found that small grains (a ≲ 0.1 μm) are quickly sputtered and destroyed, whereas larger grains survive the shock interaction. They also showed that higher shock velocities lead to up to ∼50% more destruction, and that metal-rich ejecta can enhance cooling and modify the destruction efficiency. More recent numerical studies of dust in clumpy supernova ejecta (Kirchschlager et al. 2019, 2023, 2024) have confirmed these trends. For example, Kirchschlager et al. (2019) used hydrodynamic simulations of Cas A knots and found that up to 40% of the dust mass can survive the reverse shock, especially for intermediate grain sizes or high-density clumps. They also found that small grains and certain compositions are more easily destroyed, and that grain–grain collisions can alter the size distribution of the survivors. Including magnetic fields, Kirchschlager et al. (2023) showed that field orientation and clump density contrast strongly affect survival: for perpendicular fields, small grains are completely destroyed, while large grains (∼1 μm) survive with high efficiency; for higher density contrast, even nanometer grains can survive in part. Finally, Kirchschlager et al. (2024) studied a time-dependent model of Cas A and found that most dust is processed in the first few hundred years, with survival fractions ranging from ∼17% for 1 nm grains to ∼28% for 1000 nm grains integrated over the remnant age. One can note that dust-induced cooling has not been incorporated into such models.
Dust in SNRs can also be observed directly in surviving clumps. For instance, Grenman et al. (2017) cataloged small dusty globules in the Crab Nebula (the remnant of SN 1054). These globules are ∼400 − 2000 AU in size (peaking at ∼500 AU), contain 10−6 − 10−5 M⊙ of dust each, and appear as dark spots against the synchrotron background. Their spatial distribution and alignment with optical filaments suggest that they are dense knots of ejecta that have retained their dust. The dust extinction law in these globules matches normal ISM dust, implying survival of typical grains. These observations motivate models of clumpy SN ejecta in which dust can indeed endure shock passage. Thus, understanding the interplay of cooling, shock dynamics, and additionally clump density is crucial to predicting how much SN dust is ultimately injected into the ISM.
Analytical treatments of cloud and/or clump survival have advanced in recent years. Gronke & Oh (2018, 2020a, see also Li et al. 2020) developed a criterion comparing the cooling time of the turbulent mixing layer at the cloud–flow interface to the cloud–crushing time, identifying regimes of destruction versus survival and growth. In the growth regime, rapid cooling makes mixing “accretive”: freshly mixed gas condenses onto the cold phase, the shear layer thins, and the growth of hydrodynamical instabilities is suppressed. This approach is adopted here and adapted to the dense, dust-enriched clumps observed in SN ejecta, whereby the characteristic timescale for a shock to crush the clump (the cloud-crushing time) is compared to the radiative cooling time of the shocked gas within and around the clump. In addition, radiative cooling induced by gas–grain thermal collisions is consistently incorporated into this framework (Dwek 1987; Martínez-González et al. 2016).
The structure of the paper is as follows. Section 2 presents the analytic model and methods. Section 3 explores the parameter-space of shock velocities, clump densities and dust-to-gas mass ratios. Section 4 summarizes the main conclusions and discusses their implications.
2. Analytic model and methods
2.1. Cloud-crushing timescale
Consider a spherical clump of radius Rcl and density ncl embedded in an ejecta flow of density nej and shock velocity vsh. When the planar shock encounters the clump, it drives a transmitted shock into the clump; the classical cloud-crushing time is defined as (McKee & Ostriker 1977; Klein et al. 1994)
 (1)
(1)
which represents the time required for the shock to traverse the clump1. The post-shock temperature of the clump gas is given by the Rankine–Hugoniot jump conditions for a strong shock (Zel’dovich & Raizer 1967),
 (2)
(2)
where mH is the hydrogen mass and kB is the Boltzmann constant. Immediately behind the shock, the clump density is nsh = 4nej, and the mixed density between shocked clump and ejecta is taken as
 (3)
(3)
To assess whether the clump cools radiatively before being destroyed, one can compute the ratio between the cooling and the cloud crushing times (Gronke & Oh 2018, 2020a; Li et al. 2020),
 (4)
(4)
where Λtot(T) is the total cooling function (gas+dust) evaluated at the post-shock temperature, Tcl, sh, and Lcool ≡ vshtcool is the post-shock cooling length. Accordingly, one can define the clump–frame cooling length,  , so that the ratio takes the compact form
 (5)
(5)
Note that since χ = ncl/nej enters both tcc ∝ χ1/2 and nmix = 2nclχ−1/2, nej cancels out of the ratio, leaving tcool/tcc independent of nej.
2.2. Radiative cooling times
The total cooling rate per unit volume at temperature T is written as the sum of gas-phase cooling and dust-induced cooling,
 (6)
(6)
where Λgas(T) was obtained by interpolating the tabulated log T − logΛ data of Schure et al. (2009) above 104 K, and Dalgarno & McCray (1972) for ≤104 K. The dust-induced cooling curves, arising from inelastic collisions between thermal electrons (and ions) and dust grains, were calculated as was prescribed by Dwek (1987, see Fig. 1 and Appendix A in Martínez-González et al. 2016). A log-normal grain-size distribution was assumed (Martínez-González et al. 2021),
![Mathematical equation: $$ \begin{aligned} \frac{\mathrm{d}n}{\mathrm{d}a} \propto \frac{1}{a} \exp \!\left[-\frac{\ln ^{2}(a/a_{\rm peak})}{2\sigma ^{2}}\right], \end{aligned} $$](/articles/aa/full_html/2025/10/aa56389-25/aa56389-25-eq8.gif) (7)
(7)
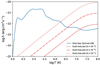 |
Fig. 1. Cooling rate per unit volume vs. temperature. Solid curve: Gas-phase cooling Schure et al. (2009). Dashed, dash-dotted, dotted: Dust-induced cooling for 𝒟 = 10−4, 10−3, 10−2, respectively, assuming a log-normal grain-size distribution (5 nm < a < 0.5 μm). |
truncated between amin = 0.005 μm and amax = 0.5 μm, with apeak = 0.10 μm and σ = 0.7, and normalized to the assumed value of 𝒟.
2.3. Grain processing
Within the shocked clump layer, the gas undergoes cooling from its post-shock temperature, Tcl, sh, until either radiative losses cease or a thermal floor is reached. Grain processing operates only within restricted intervals: thermal sputtering requires T ≳ 5 × 10⁵ K (Bocchio et al. 2014), while grain growth by accretion occurs for T ≲ 2 × 10³ K (Nozawa et al. 2012). The effective timescales of each regime along the cooling trajectory are
 (8)
(8)
 (9)
(9)
where  for isobaric cooling and
  for isochoric cooling, with P = n(T)kBT and Tfloor = 100 K the terminal gas temperature. If the gas does not cool from 106 K to 103 K within one tcc, then tgrow is set to 0 s.
The sizes of dust grains are the result of the balance between the accretion growth rate ( ) and the thermal sputtering rate (
 ). Evaluated along the cooling trajectory, their cumulative impact is captured by
 (10)
(10)
with ℛ > 1 indicating net growth and ℛ < 1 net destruction within the shocked region.
The accretion growth rate, as a function of the gas number density, n, and temperature, T, was evaluated as (Spitzer 1978)
 (11)
(11)
with Sstick = 1 (justified for grain temperatures ≲30 K and binding energies ≳0.1 eV (≈1100 K), Ferrara et al. 2016), grain density ρgr = 2.26 g cm−3, and key species mass ms = 12 mH (carbon). The thermal sputtering rate was calculated using the approximation made by Tsai & Mathews (1995) to the results of Tielens et al. (1994) and Draine & Salpeter (1979),
![Mathematical equation: $$ \begin{aligned} \dot{a}_{\mathrm{sput} } = -1.4 n h \left[\left(\frac{10^6\,\mathrm{K}}{T}\right)^{2.5} + 1\right], \end{aligned} $$](/articles/aa/full_html/2025/10/aa56389-25/aa56389-25-eq17.gif) (12)
(12)
where h = 3.2 × 10⁻¹⁸ cm4 s−1. Apart from thermal sputtering, other prominent destruction and/or disruption channels are kinetic sputtering and shattering due to grain–grain collisions (e.g., Kirchschlager et al. 2019).
3. Parameter-space analysis
The analysis covers a grid across shock velocities of vsh = 100 − 5000 km s−1 and clump densities of ncl = 103 − 108 cm−3, with the ratio tcool/tcc computed for each case. The dust-to-gas mass ratio, 𝒟, was varied from 0 to 10−2 to assess the role of dust-induced cooling. The clump radius was fixed at Rcl = 500 AU (the peak of the size distribution derived by Grenman et al. 2017 for the dusty globules in the Crab Nebula).
Figure 2 shows the boundary at tcool/tcc = 1, where the transmitted shock changes from adiabatic to radiative. For tcool < tcc, radiative losses confine significant shock-heating to a superficial layer of depth ≈ℓcool, cl, limiting grain exposure to temperatures favorable for thermal sputtering. Condensation from the shocked flow preserves the clump’s cold gas mass and can even increase it (Gronke & Oh 2018). For tcool > tcc, the shock remains quasi-adiabatic, leading to clump disruption.
 |
Fig. 2. Regimes of clump survival versus crushing for clumps with Rcl = 500 AU. The maps show tcool/tcc as a function of shock velocity and clump density. The panels correspond to cases with metal-line cooling only (top left), and different dust-to-gas mass ratios: 𝒟 = 10−4 (top right), 𝒟 = 10−3 (bottom left), and 𝒟 = 10−2 (bottom right). The solid red lines mark tcool = tcc. Clumps above the line (lower vsh or higher ncl) can cool or grow, while below the line they are crushed. Higher dust-to-gas mass ratios expand the survival region. Dashed blue: Isobaric ℛ = 1. Dotted purple: Isochoric ℛ = 1. Isochoric crossings occur only at vsh ≲ a few 102 km s−1; realistic clumps fall between these limits. In both cases, regions above the ℛ = 1 lines correspond to grain growth exceeding thermal sputtering. The hatched area indicates the range of observed dusty globules in the Crab Nebula. |
Crucially, as 𝒟 grows beyond ∼10−3, the cooling timescale falls below the cloud-crushing time across a broader range of clump densities and shock velocities, shifting the survival boundary toward higher shock speeds. For example, at ncl = 2 × 104 cm−3, a clump with 𝒟 = 10−2 can withstand shocks up to ∼2000 km s−1, whereas in the absence of dust it would be destroyed at velocities as low as ∼500 km s−1.
In the radiative regime, the growth of Kelvin–Helmholtz instabilities are expected to be suppressed (Gronke & Oh 2020a). One could also anticipate that the fast weakening of the transmitted shock may suppress kinetic sputtering, another important channel for grain destruction (Kirchschlager et al. 2024, and references therein); however, this needs to be tested via full magneto–hydrodynamical simulations.
The dashed blue (isobaric) and dotted purple (isochoric) curves mark ℛ = 1. In the isobaric case, the curve is most extended for 𝒟 = 10−2 (bottom right panel), but short segments are also present in the other panels. Wherever this curve appears, the shocked gas cools to ≲2 × 10³ K within one tcc, so grain growth at least balances and locally exceeds thermal sputtering, yielding a net positive effect on dust survival. For 𝒟 = 10−2, the tcool/tcc = 1 and ℛ = 1 contours track each other closely in the ncl − vsh plane, whereas at lower 𝒟 their overlap is confined to a much narrower region. In the isochoric extreme, ℛ exceeds unity only at vsh ∼ 100 − 300 km s−1.
The analytic regime diagrams also show that the dusty globules in the Crab Nebula are well within the survival region for a wide range of parameters. Grenman et al. (2017) report typical clump dust mass densities of ∼8 × 10⁻²² to ∼7 × 10⁻²¹ g cm−3, which, assuming a dust-to-gas mass ratio of 𝒟 = 10−2 and a mean molecular weight of μmol = 2.33mH, translates into ncl ∼ 2 × 10⁴ − 1.8 × 105 cm−3. These values lie in the regime in which tcool ≪ tcc, consistent with the observed presence of cold dust.
As has been shown by Gronke & Oh (2020b), under strong pressure perturbations and high density contrasts, a cloud or clump may undergo fragmentation into fine droplets rather than remaining coherent; the present analytic framework does not account for either this potential fragmentation pathway or the differing dust survival prospects in droplet ensembles.
4. Conclusions
This work adapts the analytic cloud-crushing model of Gronke & Oh (2018, 2020a) and Li et al. (2020) to the case of dusty clumps in SN ejecta. By comparing the cloud-crushing time to the cooling time (including gas and dust cooling), this work shows that many SN clumps lie in a regime in which cooling is so efficient that the shock-compressed gas can radiate away its energy, allowing the clump to remain cold and even gain mass. Dust plays a crucial role by boosting radiative cooling. This means that, contrary to the expectation of wholesale destruction, a significant fraction of dusty clumps in SNRs may survive the reverse shock.
This regime is analogous to the “growth” regime identified in circumgalactic clouds (Li et al. 2020) and rapidly cooling shocked stellar winds (Palouš et al. 2014; Wünsch et al. 2017). Our results imply that clumps in, for example, young SNRs such as Cas A or the Crab Nebula, can harbor surviving dust. In particular, the dusty globules in the Crab nebula fall in the predicted survival zone, suggesting that they are simply clumps whose cooling time was much shorter than their destruction time.
In summary, dust-mediated cooling can protect ejecta clumps from destruction and may even enhance cold-mass growth and dust grain growth in SNRs. This supports the picture that core-collapse supernovae can inject dust into the ISM more effectively than previously thought, as many clumps act as self-shielded reservoirs that deliver dust to the interstellar medium (see also Martínez-González 2025, and references therein).
Finally, the present analytic framework, built on the cloud crushing paradigm, does not capture magnetic fields, grain–grain collisions, and charge-dependent (Coulomb and Lorentz) forces, or other nonlinear gas dynamical effects. Therefore the condition tcool/tcc < 1 should be regarded as an indicator of enhanced chances for dust survival, but not as a sufficient criterion. Dedicated, high-resolution magneto-hydrodynamical simulations that include dust microphysics and that compare grain growth and destruction rates are required to calibrate tcc beyond the classical definition by McKee & Ostriker (1977) and to quantitatively test the clump survival pathways suggested by Gronke & Oh (2020a,b) and the reverse shock models of Kirchschlager et al. (2019, 2023, 2024) when dust-induced cooling is considered.
Recent hydrodynamical and magnetohydrodynamical simulations (e.g., Kirchschlager et al. 2024 and references therein) demonstrate that the effective “cloud-crushing” time can deviate significantly from the classical McKee & Ostriker (1977) estimate. The analytic tcc used here should be regarded as a benchmark scaling.
Acknowledgments
The author thank the anonymous referee for their helpful comments and suggestions which improved the quality of the paper.
References
- Bocchio, M., Jones, A. P., & Slavin, J. D. 2014, A&A, 570, A32 [NASA ADS] [CrossRef] [EDP Sciences] [Google Scholar]
- Dalgarno, A., & McCray, R. A. 1972, ARA&A, 10, 375 [Google Scholar]
- Draine, B. T., & Salpeter, E. E. 1979, ApJ, 231, 77 [NASA ADS] [CrossRef] [Google Scholar]
- Dwek, E. 1987, ApJ, 322, 812 [NASA ADS] [CrossRef] [Google Scholar]
- Ferrara, A., Viti, S., & Ceccarelli, C. 2016, MNRAS, 463, L112 [NASA ADS] [CrossRef] [Google Scholar]
- Grenman, T., Gahm, G. F., & Elfgren, E. 2017, A&A, 599, A110 [NASA ADS] [CrossRef] [EDP Sciences] [Google Scholar]
- Gronke, M., & Oh, S. P. 2018, MNRAS, 480, L111 [Google Scholar]
- Gronke, M., & Oh, S. P. 2020a, MNRAS, 492, 1970 [Google Scholar]
- Gronke, M., & Oh, S. P. 2020b, MNRAS, 494, L27 [Google Scholar]
- Kirchschlager, F., Schmidt, F. D., Barlow, M. J., et al. 2019, MNRAS, 489, 4465 [CrossRef] [Google Scholar]
- Kirchschlager, F., Schmidt, F. D., Barlow, M. J., De Looze, I., & Sartorio, N. S. 2023, MNRAS, 520, 5042 [NASA ADS] [CrossRef] [Google Scholar]
- Kirchschlager, F., Sartorio, N. S., De Looze, I., et al. 2024, MNRAS, 528, 5364 [NASA ADS] [CrossRef] [Google Scholar]
- Klein, R. I., McKee, C. F., & Colella, P. 1994, ApJ, 420, 213 [Google Scholar]
- Li, Z., Hopkins, P. F., Squire, J., & Hummels, C. 2020, MNRAS, 492, 1841 [NASA ADS] [CrossRef] [Google Scholar]
- Martínez-González, S. 2025, ApJ, 983, 172 [Google Scholar]
- Martínez-González, S., Tenorio-Tagle, G., & Silich, S. 2016, ApJ, 816, 39 [Google Scholar]
- Martínez-González, S., Silich, S., & Tenorio-Tagle, G. 2021, MNRAS, 507, 1175 [Google Scholar]
- McKee, C. F., & Ostriker, J. P. 1977, ApJ, 218, 148 [NASA ADS] [CrossRef] [Google Scholar]
- Nozawa, T., Kozasa, T., & Nomoto, K. 2012, ApJ, 756, L35 [Google Scholar]
- Palouš, J., Wünsch, R., & Tenorio-Tagle, G. 2014, ApJ, 792, 105 [CrossRef] [Google Scholar]
- Schure, K. M., Kosenko, D., Kaastra, J. S., Keppens, R., & Vink, J. 2009, A&A, 508, 751 [NASA ADS] [CrossRef] [EDP Sciences] [Google Scholar]
- Silvia, D. W., Smith, B. D., & Shull, J. M. 2010, ApJ, 715, 1575 [NASA ADS] [CrossRef] [Google Scholar]
- Silvia, D. W., Smith, B. D., & Shull, J. M. 2012, ApJ, 748, 12 [NASA ADS] [CrossRef] [Google Scholar]
- Spitzer, L. 1978, Physical Processes in the Interstellar Medium (New York: Wiley) [Google Scholar]
- Tielens, A. G. G. M., McKee, C. F., Seab, C. G., & Hollenbach, D. J. 1994, ApJ, 431, 321 [NASA ADS] [CrossRef] [Google Scholar]
- Tsai, J. C., & Mathews, W. G. 1995, ApJ, 448, 84 [CrossRef] [Google Scholar]
- Wünsch, R., Palouš, J., Tenorio-Tagle, G., & Ehlerová, S. 2017, ApJ, 835, 60 [CrossRef] [Google Scholar]
- Zel’dovich, Y. B., & Raizer, Y. P. 1967, Physics of Shock Waves and High-temperature Hydrodynamic Phenomena (New York: Academic Press) [Google Scholar]
All Figures
|
Fig. 1. Cooling rate per unit volume vs. temperature. Solid curve: Gas-phase cooling Schure et al. (2009). Dashed, dash-dotted, dotted: Dust-induced cooling for 𝒟 = 10−4, 10−3, 10−2, respectively, assuming a log-normal grain-size distribution (5 nm < a < 0.5 μm). |
| In the text | |
|
Fig. 2. Regimes of clump survival versus crushing for clumps with Rcl = 500 AU. The maps show tcool/tcc as a function of shock velocity and clump density. The panels correspond to cases with metal-line cooling only (top left), and different dust-to-gas mass ratios: 𝒟 = 10−4 (top right), 𝒟 = 10−3 (bottom left), and 𝒟 = 10−2 (bottom right). The solid red lines mark tcool = tcc. Clumps above the line (lower vsh or higher ncl) can cool or grow, while below the line they are crushed. Higher dust-to-gas mass ratios expand the survival region. Dashed blue: Isobaric ℛ = 1. Dotted purple: Isochoric ℛ = 1. Isochoric crossings occur only at vsh ≲ a few 102 km s−1; realistic clumps fall between these limits. In both cases, regions above the ℛ = 1 lines correspond to grain growth exceeding thermal sputtering. The hatched area indicates the range of observed dusty globules in the Crab Nebula. |
| In the text | |
Current usage metrics show cumulative count of Article Views (full-text article views including HTML views, PDF and ePub downloads, according to the available data) and Abstracts Views on Vision4Press platform.
Data correspond to usage on the plateform after 2015. The current usage metrics is available 48-96 hours after online publication and is updated daily on week days.
Initial download of the metrics may take a while.