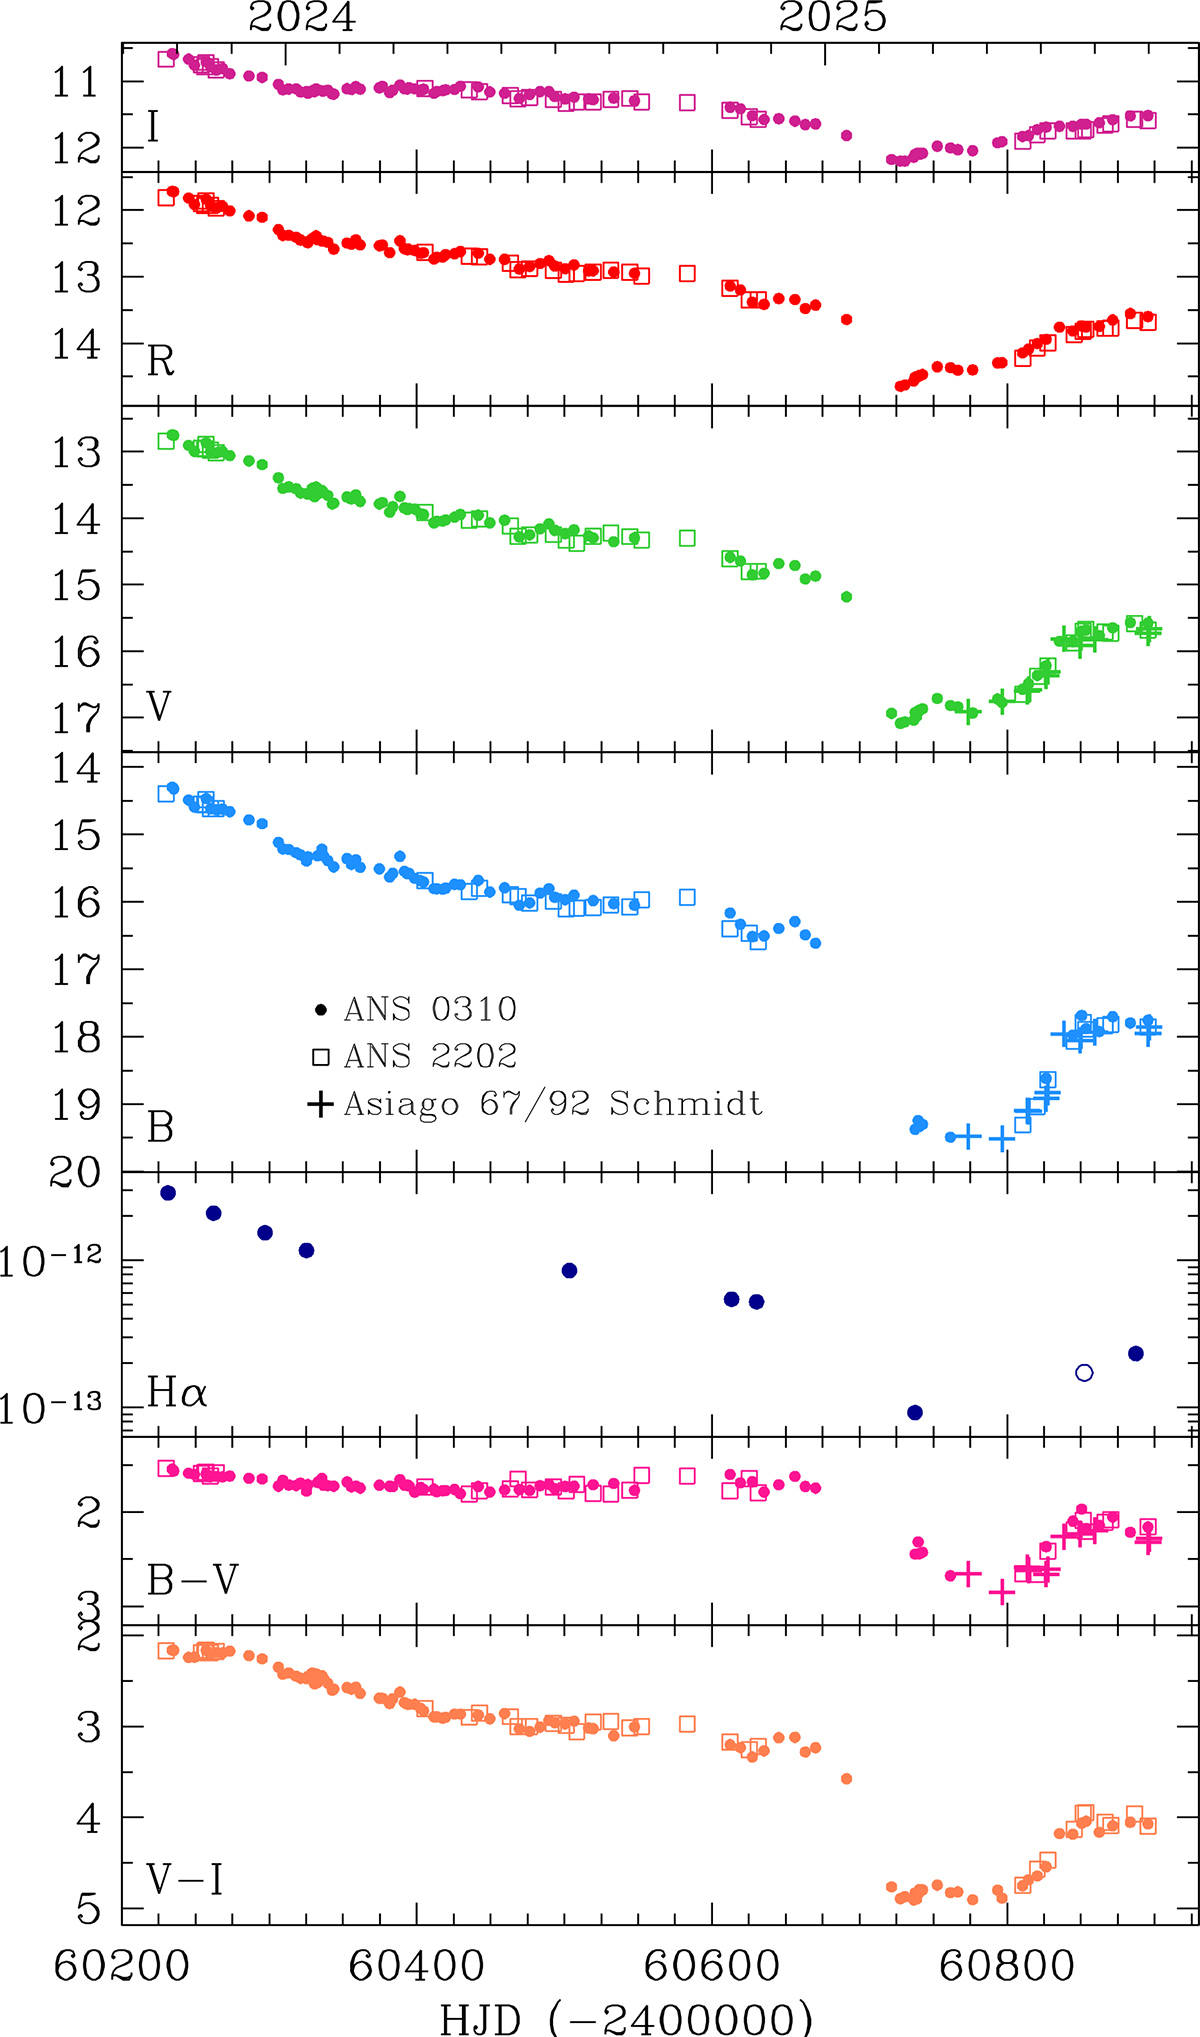
Fig. 1.
Download original image
ANS Collaboration B V R I photometry (in magnitudes) of AT 2023txn over 2023-2025. The Hα panel shows the integrated flux (in erg cm−2 s−1) of the Hα emission line measured on the nine Asiago 1.22m + B&C spectra presented in Fig. 2 and on a spectrum obtained on 2025-06-25 with the Varese 0.84m telescope (plotted as an open circle).
Current usage metrics show cumulative count of Article Views (full-text article views including HTML views, PDF and ePub downloads, according to the available data) and Abstracts Views on Vision4Press platform.
Data correspond to usage on the plateform after 2015. The current usage metrics is available 48-96 hours after online publication and is updated daily on week days.
Initial download of the metrics may take a while.