| Issue |
A&A
Volume 702, October 2025
|
|
|---|---|---|
| Article Number | A269 | |
| Number of page(s) | 11 | |
| Section | Stellar structure and evolution | |
| DOI | https://doi.org/10.1051/0004-6361/202556393 | |
| Published online | 29 October 2025 | |
AT 2023txn (Gaia23cse): A new symbiotic star undergoing a puzzling outburst
1
INAF National Institute of Astrophysics, Astronomical Observatory of Padova, 36012
Asiago (VI), Italy
2
ANS Collaboration, c/o Astronomical Observatory, 36012
Asiago (VI), Italy
3
INAF Osservatorio di Astrofisica e Scienza dello Spazio, Via Gobetti 93/3, 40129
Bologna, Italy
4
Departamento de Ciencias Físicas, Universidad Andrés Bello, Fernández Concha 700, Las Condes, Santiago, Chile
⋆ Corresponding author: This email address is being protected from spambots. You need JavaScript enabled to view it.
Received:
13
July
2025
Accepted:
13
August
2025
Abstract
Since it began in 2022, the outburst of AT 2023txn continues to unfold via multiple maxima and deep minima, bringing the system well below quiescence brightness. It has been monitored with B V R I g r i photometry, low- and high-resolution spectroscopy, and Swift XRT+UVOT observations. AT 2023txn has turned out to be a previously unknown symbiotic star, harboring an M6III red giant of great photometric stability during quiescence. A large and cold accretion disk around the white dwarf companion provided about 3/4 of the system brightness at blue wavelengths during quiescence; however, it was unable to power a significant emission-line spectrum, as implied by the 2004 observations from the IPHAS r iHα survey and Gaia DR3 BP RP spectrum. The outburst begun toward the end of 2021, passed through a first unnoticed maximum in March 2022, and was eventually announced as transient Gaia23cse ∼19 months later (in September 2023) when the object was peaking at a second and brighter maximum. Close to that epoch, we measured 1500 L⊙ as the luminosity radiated by the outbursting component over the 2000–9000 Å interval, with an upper limit of < 1 L⊙ to the X-ray luminosity over the 0.3−10 keV range. The emission-line spectrum has been characterized by persistent low ionization conditions, with FeII and Balmer series being the dominating species and varying their integrated flux in phase with the brightness evolution during the outburst. Three deep minima separated by ∼866 days brought the system Δg ∼ 1.5 mag below the brightness in quiescence, but they have no counterpart prior to the start of the outburst season. Interpreting them as eclipses of the hot component by the red giant encounters severe difficulties; thus, alternative explanations have been considered within the framework of a massive accretion disk similar to T CrB transferring mass to the WD only episodically via a collapse, which affects the inner radii.
Key words: accretion, accretion disks / binaries: symbiotic / novae, cataclysmic variables / stars: individual: AT 2023txn
© The Authors 2025
 Open Access article, published by EDP Sciences, under the terms of the Creative Commons Attribution License (https://creativecommons.org/licenses/by/4.0), which permits unrestricted use, distribution, and reproduction in any medium, provided the original work is properly cited.
This article is published in open access under the Subscribe to Open model. This email address is being protected from spambots. You need JavaScript enabled to view it. to support open access publication.
1. Introduction
AT 2023txn was first discovered on 2023-09-29 at G = 11.83 mag by Gaia satellite through the Gaia Science Alerts pipeline (Hodgkin et al. 2021) as transient Gaia23cse at coordinates (J2000) 19:50:33.32 +30:28:22.40 (Hodgkin et al. 2023). As discussed in Sect. 3.3, the outburst was however already unfurling by at least 19 months when it was detected by Gaia. A couple of low-resolution optical spectra (range 4000–7500 Ang) were obtained in the immediate aftermath of the Gaia announcement by Fujii et al. (2023), who proposed that the object might actually be a nova. Their spectra showed narrow Balmer and FeII emission lines superimposed onto a steeply red continuum.
The transient appears to coincide with source ZTF J195033.33+302822.4, reported by the ZTF catalog of periodic variable stars (Chen et al. 2020) to be a semi-regular variable of 56.18 days period, 0.3 mag amplitude, and mean values g = 17.136 and r = 14.598 mag. The same source is listed also in the second Gaia catalogue of long-period variable candidates (Lebzelter et al. 2023), with no further information. For this source, the Gaia DR3 catalog (Gaia Collaboration 2016, 2023) reports BP = 16.20 and RP = 11.71 mag, a parallax of 0.1221 ± 0.0397 milli-arcsec, and a radial velocity of −62.46 ± 1.61 km s−1, while the values derived from Palomar sky-survey plates and listed in NOMAD (Zacharias et al. 2004) are B = 16.76, V = 15.28, and R = 14.35 mag.
Noting the spatial coincidence with the red giant ZTF J195033.33+302822.4, soon after its announcement, we started a monitoring campaign of AT 2023txn, considering the prospect it could turn out to be a previously unknown symbiotic star revealed by the current outburst. Symbiotic stars (SySts) are interacting binaries composed by a red giant (RG) and a white dwarf (WD) powered either by accretion through a disk (see Munari 2019, for a recent review) and toward the WD (accreting-only SySts) or by nuclear burning on the surface of the latter of the material previously accumulated (burning-type SySts). The latter type of SySts are the brightest and the easiest to discover, which account for their dominance in current catalogs of SySts (Belczyński et al. 2000; Merc et al. 2019; Akras et al. 2019)
We have been following AT 2023txn photometrically (in the B V R I g r i bands) and spectroscopically (at both low and high resolution), with an X-ray and UV observation with the Swift satellite performed on 2024-01-24. In this paper, we report our observational effort and our modeling and classification of the object in combination with existing catalog data.
2. Observations
2.1. BVRIgri photometry
The B V R I photometry of AT 2023txn was collected between 2023-10-12 to 2025-07-01 with ANS Collaboration telescopes ID 0310 and 2202, and with the Asiago 67/92 cm Schmidt camera, while g r i photometry was recorded with ANS Collaboration telescope ID 0311. All bands have been observed on each visit to the object. In total, we collected 143 B V R I sets distributed on 127 individual nights, along with 22 g r i sets over 21 individual nights. All the photometry was transformed from the local instantaneous photometric system to the Landolt (1992, 2009) standard system via color equations solved for all frames of each night via a B V R I g r i reference sequence located around AT 2023txn and extracted from APASS DR8 all-sky survey (see Henden & Munari 2014, for details), with color transformations adopted from Munari et al. (2014). The same reference sequence was used at all telescope on all nights, ensuing a high degree of homogeneity over the entire photometric dataset. The collected photometric data are listed in Tables 1 and B.1, where the quoted uncertainties are the total error budget (TEB), which quadratically combine the Poisson error and the error associated with the transformation to the standard system via the color equations (usually the dominating term). The resulting B V R I light- and color-curves are plotted in Fig. 1.
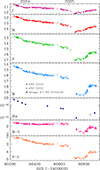 |
Fig. 1. ANS Collaboration B V R I photometry (in magnitudes) of AT 2023txn over 2023-2025. The Hα panel shows the integrated flux (in erg cm−2 s−1) of the Hα emission line measured on the nine Asiago 1.22m + B&C spectra presented in Fig. 2 and on a spectrum obtained on 2025-06-25 with the Varese 0.84m telescope (plotted as an open circle). |
Our B V R I photometry of AT 2023txn.
2.2. Spectroscopy
Low-resolution spectroscopy of AT 2023txn was obtained with the Asiago 1.22m + B&C telescope (range 3200–8000 Å, dispersion 2.31 Å/pix). The detector is an Andor iDus DU440 CCD camera (2048 × 512 pixels, 13.5 × 13.5 μm each), characterized by a high near-UV sensitivity. The slit was set to a width of 2 arcsec and has always been rotated to the parallactic angle for optimal flux calibration against the spectrophotometric standards observed on each night. The slit height of ∼8 arcmin allows for a careful sampling and subtraction of the sky background. We observed AT 2023txn at nine distinct epochs distributed in time to cover from maximum brightness down to the faintest state during minima. The absolutely fluxed spectra are presented in Fig 2.
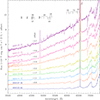 |
Fig. 2. Spectroscopic evolution of AT 2023txn as tracked with the Asiago 1.22m + B&C telescope, from maximum brightness in October 2023 down to the center of the deep minimum in March 2025. The strongest emission lines pertain to the hydrogen Balmer series and to FeII multiplets (identified by comb-like markings). |
High-resolution spectra of AT 2023txn were recorded with the Asiago 1.82m telescope + REOSC Echelle spectrograph. The 3550–7100 Å interval is covered in 32 orders without inter-order gaps by an Andor DW436-BV camera (housing an E2V CCD42-40 AIMO CCD, with 2048 × 2048 array, and 13.5 μm pixel size). The resolving power is 22 000 for a 1.8-arcsec slit-width. The slit height of 22 arcsec allows for free 8 arcsec recordings on both sides of the stellar spectrum to ensure a careful definition of the sky background that needs to be subtracted. Figure 3 presents the Hα and NaI profiles extracted from these spectra.
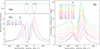 |
Fig. 3. Top-left panel: Fully split stellar and interstellar absorption components to NaI 5890 from the Asiago 1.82m + Echelle high-resolution spectrum of AT 2023txn for 2024-01-29. Bottom-left panel: Hα profiles of AT 2023txn from the Asiago 1.82m + Echelle high-resolution spectra. Right panel: Evolution of the Hα profile on the Varese 0.84m + Echelle high-resolution spectra. All phases ϕ are computed according to Eq. (1). |
Echelle spectra of AT 2023txn were also obtained with the Varese 0.84 m telescope, equipped with a long-slit mark.III Multi-Mode Spectrograph (MMS) from Astrolight Instr. The camera is a SBIG ST10XME CCD and the 4250–8850 Årange is covered in 32 orders without inter-order gaps. A 1 × 1 binning and 2.0-arcsec slit-width provide a resolving power ∼17 000. A final spectrum was obtained at 2 × 2 binning on 2025-06-27 (resolving power 9000) when the brightness of the object had much declined compared to outburst maximum. The evolution of the Hα profile as recorded with the Varese 0.84m + Echelle telescope is presented in Fig. 3. With the same telescope and the MMS spectrograph configured for low-res spectroscopy, a 4300–8600 Å spectrum of AT 2023txn was recorded at 2.35 Å/pix on 2025-06-25.
Table C.1 provides a comprehensive log book of the spectroscopic observations we collected of AT 2023txn. All spectra acquired with the Asiago and Varese telescopes have been similarly reduced in IRAF, with all standard steps involving correction for bias, dark and flat frames, sky subtraction, wavelength and flux calibration, and heliocentric correction applied.
2.3. Swift observations
A target-of-opportunity observation of AT 2023txn was performed with the Swift satellite (Gehrels et al. 2004) starting at 04:48 UT of January 24, 2024. Data were acquired with the X-Ray Telescope (XRT; Burrows et al. 2005) and the UltraViolet Optical Telescope (UVOT; Roming et al. 2005). The XRT covers the 0.3–10 keV X-ray band, whereas UVOT used the UVM2 ultraviolet filter, with reference wavelength 2246 Å, (see Poole et al. 2008; Breeveld et al. 2011, for details). The two instruments observed AT 2023txn simultaneously; the XRT pointing lasted 3285 s whereas the UVOT one was 1595 s long. All data were reduced within the FTOOLS environment (Blackburn 1995).
The UVM2 magnitude of AT 2023txn was measured through aperture photometry within a 10′′ radius centered on the source position, whereas the corresponding background was evaluated using a combination of several circular regions in source-free nearby areas on the UVOT image. The choice of an aperture photometry radius larger than usual (5′′) was made to address the excess broadening of the UVOT images point spread function produced by issues in the spacecraft attitude control (Cenko 2023; Hussenot-Desenonges et al. 2024; Srinivasaragavan et al. 2024). The data were then calibrated using the UVOT photometric system described by Poole et al. (2008); the most recent fixings (2020 November) recommended by the UVOT team were taken into account and a check to reject small scale sensitivities1 was also performed.
AT 2023txn is barely detected in the UVOT image: its UVM2 magnitude, determined with the UVOTSOURCE task, is 19.7 ± 0.3. This, assuming a color excess towards the source E(B − V) = 1.0 mag (see Sect. 4) and following the prescription of Kataoka et al. (2008, their Table 5) implies a de-reddened magnitude UVM20 = 12.5 ± 0.3. These correspond to flux densities of (6.2 ± 1.7) × 10−17 and (4.8 ± 0.6) × 10−14 erg cm−2 s−1 Å−1, respectively.
The XRT data analysis was performed using the XRTDAS standard pipeline package (XRTPIPELINE v. 0.13.4). All X-ray data were acquired in photon counting mode (Hill et al. 2004). Scientific data for AT 2023txn were extracted using a radius of 47′′ (20 pixels) centered at the optical coordinates of the source, while the corresponding background was evaluated in a source-free region of radius 94′′ (40 pixels). No emission was detected in the 0.3–10 keV range using the XSPEC package down to a 3σ limit count rate of 2 × 10⁻³ counts s−1, determined using the procedure of Gehrels (1986).
We then evaluated the corresponding X-ray flux using the WEBPIMMS online tool2 by assuming a thermal bremsstrahlung emission with temperature kT = 2 keV (see e.g. Luna et al. 2013), along with an intervening hydrogen column density absorption NH = 5.5 × 1021 cm−2, obtained by once again adopting an interstellar reddening of EB − V = 1.0 along the source line of sight combined with the empirical formula of Predehl & Schmitt (1995). This implies a count rate-to-flux conversion factor of 3.4 × 10⁻¹¹ erg cm−2 s−1 counts−1, which corresponds to absorbed and unabsorbed flux limits of < 6.7 × 10⁻¹⁴ erg cm−2 s−1 and < 1.2 × 10⁻¹³ erg cm−2 s−1, respectively.
3. Long-term evolution
3.1. Building the sample
AT 2023txn is too faint in quiescence to show up in the Harvard historical photographic plates digitized as part of the DASCH program (Grindlay et al. 2012). The few logged detections (on 13 of the 2017 scanned plates imaging the field containing AT 2023txn) are discussed in Appendix A, noting that at least several of them appear to be dubious in nature. Overall, the most convincing detection on historical Harvard plates seems that of 1952, with AT 2023txn being imaged on three distinct plates spanning from August to October, at a mean of ⟨B⟩=14.55 mag, in line with the peak value B ∼ 14.3 mag of the recent outburst.
By combining Gaia, ZTF, our observations, and NeoWISE data, it is, however, possible to reconstruct the photometric evolution of AT 2023txn in the optical and infrared from 2014 to the present. The resulting light curves are shown in Fig. 4.
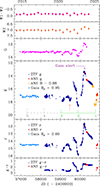 |
Fig. 4. Long-term photometric evolution of AT 2023txn reconstructed by combining ZTF g r, ANS g r B and Gaia G, BP, and RP photometry (in magnitudes). Top two panels plot the IR photometry collected at six-month cadence by the NeoWISE satellite in W1 (3.4 μm) and W2 (4.6 μm) bands. The epochs of the minima are marked on the g-band panel follow Eq. (1). The minimum marked by the orange arrow is discussed in Sect. 3.4. |
At optical wavelengths, the largest body of data is provided by 2018–2024 g,r patrol photometry from the Zwicky Transient Facility (ZTF; Masci et al. 2019). To extend the time coverage in Fig. 4, we make use of the 2014–2017 BP,RP Gaia DR3 photometry, the 2023–2025 B,g,r ANS Collaboration photometry from Table 1 and Table B.1, and the 2014–2023 white-light Gaia G-band photometry accessed via the Gaia Science Alerts website. The g-band photometric evolution and seasonal coverage of AT 2023txn is the same in ZTF and ASASSN data, but the latter are not included in Fig. 4 for their larger scatter caused by the object being detected in quiescence close to the limiting magnitude of the patrol observations. The photometric evolution of AT 2023txn at infrared wavelengths from 2014 to present is traced in Fig. 4 by W1 and W2 band data (centered respectively at 3.4 μm and 4.6 μm) collected at 6-months interval by the NeoWISE mission (Mainzer et al. 2011); 2014ApJ...792...30M. NeoWISE refers to the data the Wide-field Infrared Survey Explorer (WISE) satellite collected during 2014-2024 when it was brought out of hibernation and resumed all-sky scanning observation.
3.2. Quiescence
The 2014-2025 photometric evolution of AT 2023txn presented in Fig. 4 starts with the object being in quiescence up to 2020. During 2014–2020 AT 2023txn shows only a minimal variability at optical and infrared wavelengths, with mean values ⟨g⟩=17.13, ⟨r⟩=14.61, ⟨BP⟩=16.20, ⟨RP⟩=11.71, ⟨W1⟩=6.89, and ⟨W2⟩=7.07 mag.
The great photometric stability of AT 2023txn in quiescence (especially in the infrared where the role of the accretion disk is diminished) argues against the RG filling its Roche lobe, unless the orbital aspect is close to face-on conditions: for mid- to high-inclinations, a Roche-lobe filling RG should display a fairly large ellipsoidal variability, up to ∼0.5 mag in amplitude for i ∼ 90°, with two maxima and two minima per orbital cycle. The fact that such a modulation is not visible in Fig. 4 (ΔW2 ≤ 0.05 mag) suggests that the RG under-fills its Roche-lobe, implying a wide orbital separation and a mass accretion toward the WD companion occurring via wind-intercept rather than Roche-lobe overflow. It is worth noticing that the Hα profiles in Fig. 3 show a large excursion in radial velocity of both the absorption and the emission components, suggestive of a large-amplitude orbital motion and, therefore, a significant orbital inclination well away from face-on conditions.
3.3. Outburst
After the Solar conjunction between December 2021 and February 2022, ZTF resumed the observations of AT 2023txn on 2022-03-02, recording the object as being much brighter than in precedence and therefore clearly in outburst; however, the fact passed unnoticed and no alert was issued. The protracted outburst of AT 2023txn eventually attracted attention only 19 months later when Gaia detected the object on 2023-09-29, while it was passing at a second and brighter maximum, this time issuing an alert and naming the transient Gaia23cse, which was then logged as AT 2023txn by the TNS3 server. Even when it was finally announced, the outburst of AT 2023txn did not raise much attention other than the acquisition of two low-resolution spectra obtained soon after the announcement and uploaded to the TNS server by Fujii et al. (2023), along with a single-night B V photometry dataset collected by a member of the American Association of Variable Star Observers (AAVSO), reporting V = 13.01, B = 14.62 mag on 2023-11-14.
The light curve in Fig. 4 shows that the on-going outburst affecting AT 2023txn thus far has been characterized by two maxima, separated by ∼565 days, of unequal brightness. This was preceded by a fast rise and followed by an initially rapid decline that later progresses at a more sedate rate before plunging into pronounced drops bringing the system brightness below the level in quiescence. The first maximum was reached on 2022-03-02, when ZTF recorded AT 2023txn at g = 14.93, r = 13.50 mag, with amplitudes with respect to quiescence of Δg = 2.20 and Δr = 1.11 mag. AT 2023txn passaged at a second and brighter maximum on 2023-09-18 peaking at g = 13.27, r = 11.60 mag, corresponding to Δg = 3.86 and Δr = 3.01 mag compared to quiescence. The decline from second maximum as depicted in Fig. 1 has been particularly smooth in all photometric bands, with mean rates of ΔB = 0.0071, ΔV = 0.0063, ΔR = 0.0041, and ΔI = 0.0019 mag day−1; while the V − I color reddened at a mean rate +0.0044 mag day−1, the B − V varied much more slowly at just +0.0012 mag day−1.
The spectral evolution of AT 2023txn along the decline from its second maximum (as presented in Fig. 2) has been similarly smooth and gradual as the photometry. The spectrum for 2023-10-13, obtained close to maximum brightness, is dominated by a featureless continuum steeply rising toward the red and by sharp and low-ionization emission lines from the hydrogen Balmer series and various FeII multiplets (primarily 37, 38, 40, 42, 46, 48, 49, and 74). Hints of the TiO molecular absorption bands from the red giant are discernible only longword of 6900 Å, while the absorption features at bluer wavelengths all originate from the interstellar medium, like the CaII K and NaI atomic lines and the rich ensemble of diffuse interstellar bands (DIBs); in particular, those at 4066, 4429, 4970, 5780, 6177, 6281, and 6359 Å, which, combined with the steep red color of the continuum, are suggestive of high reddening conditions (see Sect. 4 below).
The spectroscopic evolution along the decline from maximum can be fairly well described as (i) a diminution in the veiling of the RG spectrum by a hotter continuum and (ii) a straight and progressive reduction in the flux radiated by the emission lines, without appreciable changes in the ionization degree. They remained sharp, characterized by low ionization conditions, and dominated by FeII and the Balmer series. The evolution of the integrated flux of Hα presented in Fig. 1 is representative of the rest of the emission lines. Converting the fluxes in magnitudes for an easier comparison with the photometry, the mean decline rate of Hα is 0.004 mag day−1, which is comparable to the mean decline in the B V R I photometric bands.
Also the profiles of the emission lines remained self-similar during the decline from maximum, as well illustrated by the Hα profiles in Fig. 3 which display an emission with superimposed a blue-shifted absorption component, as typical of symbiotic stars (see eg. Van Winckel et al. 1993, for an atlas of high-resolution profiles of emission line in SySts). The absorption component usually originates in the out-flowing wind of the RG that encompasses the central binary, sharing the same orbital motion of the RG and being normally blue shifted from it by the amount of wind terminal velocity (Munari 1993), with the profiles for 2024-09-21 and 2025-08-08 in Fig. 3 conforming to such an arrangement. Any wind blowing off the WD and/or the accretion disk (a condition that is more likely to be encountered during bright phases) would add its own absorption signature leading to a broader and structured absorption component, as is the case for the 2024-01-09 profile in Fig. 3.
3.4. Deep minima
A striking feature of the 2014-2025 light curve in Fig. 4 are the two deep minima centered on JD 2460768 and 2459902 (numbered N.1 and N.2 in the figure), during which AT 2023txn went below the brightness in quiescence by Δg ∼ 1.5 mag. Such minima, absent prior to 2021, started showing up at the same time the object entered the outburst season. A third minimum around 2459036 (N.3 in the figure) is evident in the Gaia G-band light curve, with ZTF g,r observations catching the exit phase. The three minima that appear regularly spaced following the ephemeris:
 (1)
(1)
which would predict a new event for August 2027. The minima are phase-plotted in Fig. 5, showing a high degree of coherence, as we would expect in case of eclipses of the hot component by the red giant. An eclipse scenario would also show a fine agreement with the shape of the last minimum (densely covered by the B V R I photometry of Fig. 1) and would also naturally account for the pure red giant spectrum that AT 2023txn displayed during the last minimum (see Fig. 2, Fig. 6, and Sect. 5 below).
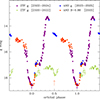 |
Fig. 5. Phase-reckoned photometry of AT 2023txn to highlight the modulation and minima following Eq. (1). The minimum marked by the orange arrow is discussed in Sect. 3.4. |
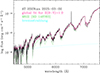 |
Fig. 6. Fit to the Asiago 1.22m + B&C spectrum for 2025-03-02 obtained right at the center of a deep minimum. The spectrum for the scaled M6III template was obtained with the same telescope, while the bremsstrahlung radiation is computed for an electronic temperature of 104 K, and the applied reddening law is that of Fitzpatrick (1999) for the standard RV = 3 case. |
The interpretation in terms of eclipses of the hot component by the red giant is still faced with significant difficulties related to the absence of minima at earlier epochs, marked as N.4 and N.5 in Fig. 4. Given the Δg ∼ 1.5 mag amplitude of the deep minima, the hot component (WD + accretion disk) must contributes about 75% of the total system brightness in quiescence at blue wavelengths and there is no easy way to justify for the missing minima during the quiescence preceding the outburst. This is similar to the case of the shallower minimum (marked by an arrow in Fig. 4 and Fig. 5), which lies close to phase 0.5 when secondary eclipses may occur, but similar events are equally missing during the quiescence.
An alternative explanation (apart from the notion that the hot component is being eclipsed by the red giant) appears to be necessary. In this regard, focusing on the temporal simultaneity between the appearance of minima and of the outburst could pave the way to a solution. We return to this idea in Sect. 8.
4. Reddening
The very red colors for AT 2023txn and the low galactic latitude suggest a large interstellar reddening affecting the object. Several diffuse interstellar bands are prominent in the Echelle spectra recorded with the Asiago 1.82 m telescope. The equivalent width of DIB 5780 is 0.51 Å, and the corresponding reddening is EB − V = 1.00, following the calibration by Kos & Zwitter (2013). That of DIB 6614 is 0.24 Å, which leads to EB − V = 1.05 mag according to the relation by Munari (2014). The interstellar NaI line is clearly saturated in the profile presented in the top panel of Fig. 3 and cannot be used, while the equivalent width of interstellar KI 7699 Å measured on the Echelle spectra recorded with the Varese 0.84 m telescope is 0.246 Å, which corresponds to EB − V = 0.98 mag following Munari & Zwitter (1997). The averaged value EB − V = 1.0 ± 0.05 mag will be adopted in this paper. Such value offers a good comparison with the 3D Galactic extinction maps of Sale et al. (2014) and Green et al. (2019), both suggesting EB − V ≥ 0.9 mag at 7.5 kpc distance along the line of sight to AT 2023txn.
5. Spectral type of the red giant
The 2025-03-02 spectrum of AT 2023txn in Fig. 2, obtained right at the center of the deep minimum N.1, is dominated by the emission of the RG; therefore, it is well-suited to derived its spectral classification. This spectrum is re-plotted on an expanded and logarithmic scale in Fig. 6. The S/N at the bluest wavelengths is poor as it may be expected given the faintness of the system shining at B = 19.5 mag, while transiting at N.1 minimum, requiring a telescope much larger than the Asiago 1.22m telescope we had available for that observation. Nonetheless, the molecular bands longward of 5000 Å are well defined and allow for a robust determination of the spectral type and a simultaneous check on the interstellar reddening by fitting with MKK primary spectral standards (selected from Morgan et al. 1943; Morgan & Keenan 1973; Yamashita & Nariai 1977), which we observed with the same equipment used for AT 2023txn. All such standard stars are close to the Sun and suffer from a small or negligible reddening; however small, prior to the comparison with AT 2023txn, their spectra were reddening-corrected by adopting the RV=3 reddening law of Fitzpatrick (1999) and the individual EB − V from Hoffleit (1991).
The best fit to the 2025-03-02 spectrum of AT 2023txn in Fig. 6 is provided by an M6III standard (HD 148783), reddened by EB − V = 1.0 mag, with a small contribution by a hot continuum (represented in the figure by the Te = 1 × 10⁴ K bremsstrahlung distribution), which is appreciable at the shortest wavelengths. The requirement about a faint hot continuum is in agreement with the fact that a weak emission in Hα remains visible even at the core of the deep minimum, indicating that some fraction of the ionized material remains visible. The EB − V = 1.0 mag required by the fit in Fig. 6 is in excellent agreement with the reddening determined in Sect. 4 from entirely independent methods, which restore confidence on both the EB − V and the spectral classification derived by the fitting in Fig. 6.
6. Distance
The small parallax (0.1221 ± 0.0397 mas) listed in Gaia DR3 indicates a large distance to AT 2023txn (at least several kpc). The associated error (33%) is however too large for an entirely safe inversion of the parallax to derive an accurate value for the distance; to achieve this, Bailer-Jones (2015) and Luri et al. (2018) recommended an error on the parallax that would not exceed 20%.
To estimate the distance to AT 2023txn we may compare it with SU Lyn, a prototype for accreting-only symbiotic stars, which harbors a similar M6III red giant and suffers from a low EB − V = 0.05 ± 0.02 mag (Mukai et al. 2016). SU Lyn is nearby and therefore its Gaia DR3 parallax is highly accurate at 1.373 ± 0.063 mas (4% error), which fixes the absolute 2MASS KS magnitude of SU Lyn to M(KS) = −7.72 ± 0.11 mag, where the error propagates the uncertainties on KS, the parallax and the reddening. Assuming that the M6III giant in AT 2023txn is characterized by the same M(KS) of the M6III giant in SU Lyn, the distance to AT 2023txn turns out to be 7.5 ± 0.3 kpc, a value that we will adopt in the rest of this paper (and which is not too far from the 8.2 kpc coming from the straight inversion of the Gaia DR3 parallax). At a Galactic latitude of |l| = 2°.038, the corresponding height above the galactic plane is 265 pc, while the Gaia DR3 tangential motion of 1.62 mas yr−1 translates to a tangential velocity of 57 km s−1, while the system radial velocity reported in Gaia DR3 is −62.1 km s−1.
7. Spectral energy distribution and outburst luminosity
The spectral energy distributions (SEDs) of AT 2023txn around outburst maximum and during minima are compared in Fig. 7 to that of an M6III template. A distance of 7.5 kpc and a reddening EB − V=1.0 mag were adopted from the steps described in the previous sections. The SED of the reference M6III is built from the intrinsic colors listed by Bessell (1990), Koornneef (1983), Lee (1970), and Wu et al. (1982), scaled to the de-reddened 2MASS Ks magnitude of AT 2023txn.
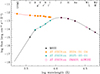 |
Fig. 7. SED of AT 2023txn at the epoch of the Swift UVM2 observation (2024-01-24, close to maximum brightness) and at the center of a deep minimum (2025-03-01). The 2MASS J H K and AllWISE W1,W2 data are not simultaneous with the rest. |
To derive the energy distribution around maximum, we used the Swift UVOT-M2 observations of 2024-01-24 and combined it with our B V R I g r i data obtained within days of the Swift visit to AT 2023txn. By integrating the difference in Fig. 7 between the SED of AT 2023txn for 2024-01-24 and the SED of the reference M6III standard, we obtained the luminosity radiated between 2000 and 9000 Å at the peak of the outburst,
 (2)
(2)
Given the fact that we did not explore shortward of the UVOT-M2 filter, this is to be considered as a lower limit to Lbol. Considering that the ionization degree of the emission line spectrum is rather low (just Balmer and FeII are visible) and the < 1 L⊙ upper limit to the extinction-corrected X-ray emission (derived in Sect. 2.3), the true value for Lbol would not be expected to be much greater than what is given by Eq. (2).
We have no UVOT observation of AT 2023txn collected around the minimum brightness reached around March 1, 2025 (as it would have been anyway too faint for detection by Swift, with an estimated UVOT-M2 ∼ 26.5 mag), only our B V R I observations were available to constrain the SED during minima. Plotted in Fig. 7, they confirm that during the deep minima the SED of AT 2023txn is completely dominated by the M6III alone, with the small contribution from the bremsstrahlung emission in Fig. 6 appearing as a tiny excess in the B band in Fig. 7.
8. The nature of the outburst and of the deep minima
There are no spectra available for AT 2023txn during quiescence from which we could infer the status of the WD and the accretion disk. They must have been however relatively cold, displaying no significant emission in Hα, considering that the IPHAS survey (Barentsen et al. 2014) measured AT 2023txn in June 2004 at Hα = 13.89, r = 14.90, and i = 12.26 mag (compared with Fig. 4, such a value for r means that AT 2023txn was at the time in quiescence). Compared with the distribution of known symbiotic stars on the IPHAS [r −Hα]/[r − i] plane (Drew et al. 2005; Corradi et al. 2008, 2010; Rodríguez-Flores et al. 2014), the reddening-corrected position of AT 2023txn lies much closer to bare M giants than to classical symbiotic stars. The BP RP low-resolution spectrum of AT 2023txn available in Gaia DR3 is the average of those collected by the satellite during 2014–2017, when AT 2023txn was in quiescence. This Gaia mean spectrum shows no hint of emission in Hα, confirming the negative detection by IPHAS of ten years earlier and reinforcing the notion that the WD and the accretion disk were cold enough to be unable to power significant emission lines during quiescence.
Overall, the situation of AT 2023txn in quiescence seems similar to that of T CrB during the protracted quiescence following the eruption of 1946. As investigated by Munari et al. (2025), this is a massive and cold accretion disk, brighter that the RG by ∼1 mag in B band and unable to power emission lines other than a weak Hα, quietly grew in mass for ∼70 yrs without transferring much of that to the WD. The majority of the accumulated mass was finally transferred to the WD in a ∼8 yr period (the so-called SAP phase) when the disk, grown beyond stable conditions, flushed toward the WD most of its content, giving rise to a surge in the system’s brightness as well as in the intensity of the emission lines. Explanations for the outburst of AT 2023txn that consider scenarios apart from a rise in the mass flow through the accretion disk are improbable, with our reasoning given below:
-
The multiple maxima, the not-so-fast rise to maximum, the low ionization conditions, the limited amplitude, and the narrow emission lines exclude an interpretation of the outburst of AT 2023txn in terms of nuclear burning in degenerate conditions, namely, a nova eruption (see Munari 2025, for a recent review of the eruption of novae in symbiotic binaries);
-
In addition, a nuclear burning igniting in non-degenerate conditions, namely, developing in thermal equilibrium, is similarly contradicted by the observations. Such an event normally takes years to reach maximum power and lasts for decades to centuries, as long as enough hydrogen fuel is present in the shell accreted by the WD (Iben 1982; Kenyon & Truran 1983);
-
The ‘Z-And’ type of outbursts are characteristic of symbiotic stars undergoing stable H-burning on their WD. These types of outbursts are probably triggered by localized mass-transfer from the disk or the red giant to the burning shell that reacts by expanding in radius and shifting the peak of its emissivity from ultraviolet to optical range. The 3-mag amplitude and the multi-peaked nature of the AT 2023txn outburst would fit in nicely with a ‘Z-And’ event; however, the appearance of AT 2023txn in quiescence is much different from that of classical symbiotic stars in stable burning conditions. The latter are much more luminous than AT 2023txn at blue wavelengths and they sport a rich ensemble of emission lines of very high intensity and a high ionization degree.
Any explanation of the outburst of AT 2023txn also needs to account for the simultaneous onset of the deep minima described in Sect. 3.4 above, bringing the overall system brightness to Δg ∼ 1.5 mag below the level of quiescence. One possibility is that the disk flushes toward the WD its inner portion, which causes the brightness peak. If the inner portion of the disk is emptied before any replenishment moves in from outer radii, the brightness of the disk at optical wavelengths will drop to negligible values and the optical photometry and spectroscopy will be dominated by the emission of the bare M6III giant, resulting in the deep minima described in Sect. 3.4. If the replenishment on the inner regions is fed by the outer disk in discrete quantities rather than in a smooth and continuous way, this could give rise to multiple maxima followed by deep minima, as observed in AT 2023txn. In this context, it is worth noticing that also the recent SAP phase of T CrB was modulated in two separated episodes and associated with two distinct brightness maxima (Munari et al. 2025).
Alternatively, the enhanced mass-flow through the disk of AT 2023txn may have been restricted to a range of azimuths or it might have given way to localized structures extending well above the main plane of the disk; lastly, it could even have warped the outer part of the disk. In all these cases, the rotation of the disk may lead the localized and optically thick structures to cross the line-of-sight to the inner and bright regions of the disk, producing both the multi-maxima modulation and even eclipses similar to the observed deep minima.
With the data at hand, useful primarily for the discovery of this interesting new symbiotic star, it seems worthless to venture further with the interpretation of the outburst and deep minima of AT 2023txn. Certainly, a protracted monitoring tailored to derive some fundamental parameters such as the orbit of the M6III giant and the system inclination, in addition to observing the further developments of the outburst, will be crucial to advancing our understanding of this object. In addition to encourage future observations in general, we will aim, in particular, to acquire regular high-resolution Echelle spectra able to track both the motion of the red giant as well that of the regions from which the emission lines originate, with a special focus on August 2027 when AT 2023txn could be passing at a new deep minimum.
Data availability
The full table 1 along with the spectra presented in Fig. 2 are available at the CDS via https://cdsarc.cds.unistra.fr/viz-bin/cat/J/A+A/702/A269.
Acknowledgments
We thank the anonymous referee for valuable and constructive suggestions that helped to improve the paper. This work has been in part supported by INAF 2023 MiniGrant Program (contract C93C23008470001 to UM). Based in part on observations obtained with the Samuel Oschin Telescope 48-inch and the 60-inch Telescope at the Palomar Observatory as part of the Zwicky Transient Facility project. ZTF is supported by the National Science Foundation under Grant No. AST-2034437 and a collaboration including Caltech, IPAC, the Weizmann Institute for Science, the Oskar Klein Center at Stockholm University, the University of Maryland, Deutsches Elektronen-Synchrotron and Humboldt University, the TANGO Consortium of Taiwan, the University of Wisconsin at Milwaukee, Trinity College Dublin, Lawrence Livermore National Laboratories, and IN2P3, France. Operations are conducted by COO, IPAC, and UW. NM acknowledges financial support through ASI-INAF 2017-14-H.0 agreement (PI: T. Belloni). Part of this work is based on online services provided by the Space Science Data Center – ASI. We also thank Brad Cenko and the Swift Team for the quick approval, scheduling and acquisition of the observation presented in this paper.
References
- Akras, S., Guzman-Ramirez, L., Leal-Ferreira, M. L., & Ramos-Larios, G. 2019, ApJS, 240, 21 [NASA ADS] [CrossRef] [Google Scholar]
- Bailer-Jones, C. A. L. 2015, PASP, 127, 994 [Google Scholar]
- Barentsen, G., Farnhill, H. J., Drew, J. E., et al. 2014, MNRAS, 444, 3230 [NASA ADS] [CrossRef] [Google Scholar]
- Belczyński, K., Mikołajewska, J., Munari, U., Ivison, R. J., & Friedjung, M. 2000, A&AS, 146, 407 [NASA ADS] [CrossRef] [EDP Sciences] [Google Scholar]
- Bessell, M. S. 1990, PASP, 102, 1181 [NASA ADS] [CrossRef] [Google Scholar]
- Blackburn, J. K. 1995, ASP Conf. Ser., 77, 367 [NASA ADS] [Google Scholar]
- Breeveld, A. A., Landsman, W., Holland, S. T., et al. 2011, Am. Inst. Phys. Conf. Ser., 1358, 373 [NASA ADS] [Google Scholar]
- Burrows, D. N., Hill, J. E., Nousek, J. A., et al. 2005, Space Sci. Rev., 120, 165 [Google Scholar]
- Cenko, B. 2023, GRB Coordinates Network, 34633, 1 [NASA ADS] [Google Scholar]
- Chen, X., Wang, S., Deng, L., et al. 2020, ApJS, 249, 18 [NASA ADS] [CrossRef] [Google Scholar]
- Corradi, R. L. M., Rodríguez-Flores, E. R., Mampaso, A., et al. 2008, A&A, 480, 409 [NASA ADS] [CrossRef] [EDP Sciences] [Google Scholar]
- Corradi, R. L. M., Valentini, M., Munari, U., et al. 2010, A&A, 509, A41 [NASA ADS] [CrossRef] [EDP Sciences] [Google Scholar]
- Drew, J. E., Greimel, R., Irwin, M. J., et al. 2005, MNRAS, 362, 753 [NASA ADS] [CrossRef] [Google Scholar]
- Fitzpatrick, E. L. 1999, PASP, 111, 63 [Google Scholar]
- Fujii, M., Kojima, T., Taguchi, K., Kato, T., & Nogami, D. 2023, Transient Name Server Classification Report, 2023–2559, 1 [Google Scholar]
- Gaia Collaboration (Prusti, T., et al.) 2016, A&A, 595, A1 [NASA ADS] [CrossRef] [EDP Sciences] [Google Scholar]
- Gaia Collaboration (Vallenari, A., et al.) 2023, A&A, 674, A1 [NASA ADS] [CrossRef] [EDP Sciences] [Google Scholar]
- Gehrels, N. 1986, ApJ, 303, 336 [Google Scholar]
- Gehrels, N., Chincarini, G., Giommi, P., et al. 2004, ApJ, 611, 1005 [Google Scholar]
- Green, G. M., Schlafly, E., Zucker, C., Speagle, J. S., & Finkbeiner, D. 2019, ApJ, 887, 93 [NASA ADS] [CrossRef] [Google Scholar]
- Grindlay, J., Tang, S., Los, E., & Servillat, M. 2012, IAU Symp., 285, 29 [Google Scholar]
- Henden, A., & Munari, U. 2014, Contributions of the Astronomical Observatory Skalnate Pleso, 43, 518 [NASA ADS] [Google Scholar]
- Hill, J. E., Burrows, D. N., Nousek, J. A., et al. 2004, SPIE Conf. Ser., 5165, 217 [Google Scholar]
- Hodgkin, S. T., Harrison, D. L., Breedt, E., et al. 2021, A&A, 652, A76 [NASA ADS] [CrossRef] [EDP Sciences] [Google Scholar]
- Hodgkin, S. T., Breedt, E., Delgado, A., et al. 2023, Transient Name Server Discovery Report, 2023–2471, 1 [Google Scholar]
- Hoffleit, D. 1991, Catalogue of Bright Stars (Yale University Observatory) [Google Scholar]
- Hussenot-Desenonges, T., Wouters, T., Guessoum, N., et al. 2024, MNRAS, 530, 1 [NASA ADS] [CrossRef] [Google Scholar]
- Iben, I. J. 1982, ApJ, 259, 244 [NASA ADS] [CrossRef] [Google Scholar]
- Kataoka, J., Madejski, G., Sikora, M., et al. 2008, ApJ, 672, 787 [Google Scholar]
- Kenyon, S. J., & Truran, J. W. 1983, ApJ, 273, 280 [Google Scholar]
- Koornneef, J. 1983, A&A, 128, 84 [NASA ADS] [Google Scholar]
- Kos, J., & Zwitter, T. 2013, ApJ, 774, 72 [NASA ADS] [CrossRef] [Google Scholar]
- Landolt, A. U. 1992, AJ, 104, 340 [Google Scholar]
- Landolt, A. U. 2009, AJ, 137, 4186 [Google Scholar]
- Lebzelter, T., Mowlavi, N., Lecoeur-Taibi, I., et al. 2023, A&A, 674, A15 [NASA ADS] [CrossRef] [EDP Sciences] [Google Scholar]
- Lee, T. A. 1970, ApJ, 162, 217 [NASA ADS] [CrossRef] [Google Scholar]
- Luna, G. J. M., Sokoloski, J. L., Mukai, K., & Nelson, T. 2013, A&A, 559, A6 [NASA ADS] [CrossRef] [EDP Sciences] [Google Scholar]
- Luri, X., Brown, A. G. A., Sarro, L. M., et al. 2018, A&A, 616, A9 [NASA ADS] [CrossRef] [EDP Sciences] [Google Scholar]
- Mainzer, A., Bauer, J., Grav, T., et al. 2011, ApJ, 731, 53 [Google Scholar]
- Mainzer, A., Bauer, J., Cutri, R. M., et al. 2014, ApJ, 792, 30 [Google Scholar]
- Masci, F. J., Laher, R. R., Rusholme, B., et al. 2019, PASP, 131, 018003 [Google Scholar]
- Merc, J., Gális, R., & Wolf, M. 2019, Res Notes Am. Astron. Soc., 3, 28 [Google Scholar]
- Morgan, W. W., & Keenan, P. C. 1973, ARA&A, 11, 29 [NASA ADS] [CrossRef] [Google Scholar]
- Morgan, W. W., Keenan, P. C., & Kellman, E. 1943, An atlas of stellar spectra, with an outline of spectral classification (University of Chicago Press) [Google Scholar]
- Mukai, K., Luna, G. J. M., Cusumano, G., et al. 2016, MNRAS, 461, L1 [NASA ADS] [CrossRef] [Google Scholar]
- Munari, U. 1993, A&A, 273, 425 [NASA ADS] [Google Scholar]
- Munari, U. 2014, ASP Conf. Ser., 490, 183 [Google Scholar]
- Munari, U. 2019, in The Impact of Binary Stars on Stellar Evolution, eds. G. Beccari, & H. Boffin [Google Scholar]
- Munari, U. 2025, Contributions of the Astronomical Observatory Skalnate Pleso, 55, 47 [Google Scholar]
- Munari, U., & Zwitter, T. 1997, A&A, 318, 269 [NASA ADS] [Google Scholar]
- Munari, U., Henden, A., Frigo, A., et al. 2014, AJ, 148, 81 [NASA ADS] [CrossRef] [Google Scholar]
- Munari, U., Walter, F., Masetti, N., et al. 2025, A&A, 701, A176 [NASA ADS] [CrossRef] [EDP Sciences] [Google Scholar]
- Poole, T. S., Breeveld, A. A., Page, M. J., et al. 2008, MNRAS, 383, 627 [Google Scholar]
- Predehl, P., & Schmitt, J. H. M. M. 1995, A&A, 293, 889 [NASA ADS] [Google Scholar]
- Rodríguez-Flores, E. R., Corradi, R. L. M., Mampaso, A., et al. 2014, A&A, 567, A49 [CrossRef] [EDP Sciences] [Google Scholar]
- Roming, P. W. A., Kennedy, T. E., Mason, K. O., et al. 2005, Space Sci. Rev., 120, 95 [Google Scholar]
- Sale, S. E., Drew, J. E., Barentsen, G., et al. 2014, MNRAS, 443, 2907 [NASA ADS] [CrossRef] [Google Scholar]
- Srinivasaragavan, G. P., Swain, V., O’Connor, B., et al. 2024, ApJ, 960, L18 [Google Scholar]
- Van Winckel, H., Duerbeck, H. W., & Schwarz, H. E. 1993, A&AS, 102, 401 [NASA ADS] [Google Scholar]
- Wu, C. C., Boggess, A., Bohlin, R. C., et al. 1982, ESA Spec. Publ., 182, 25 [Google Scholar]
- Yamashita, Y., & Nariai, K. 1977, An Atlas of representative stellar spectra (Univ. of Tokyo Press) [Google Scholar]
- Zacharias, N., Monet, D. G., Levine, S. E., et al. 2004, Am. Astron. Soc. Meeting Abstr., 205, 48.15 [Google Scholar]
Appendix A: Historical photographic photometry of AT 2023txn
To reconstruct the long-term photometric behavior of AT 2023txn, we searched the DASCH digitization of Harvard historical photographic plates (Grindlay et al. 2012), which lists data for 2017 plates imaging the field of AT 2023txn over an interval of 90 years, from 1899.776 to 1989.811. A counterpart is detected in only 13 plates, which are given below. To help guessing the confidence on such detections, we also list the closest-in-time plates bracketing each detection.
The supposed detections may either be suspiciously close to plate limit (eg. in 1917.852, 1930.477, and 1938.564), or not confirmed on a similarly deep plate for the following night (1976.585), and they are generally just a single-plate event (which does not guarantee against being fooled by plates defects), always of a brightness (much) larger that the peak value characterizing the recent outburst described in this paper.
Overall, the most convincing historical detection seems that of 1952, with AT 2023txn being seen on three plates spanning from August to October, at a mean brightness more in line with that reached at maximum of the recent outburst.
Detection of AT 2023txn on DASCH digitization of Harvard historical photographic plates.
Appendix B: gri photometry of AT 2023txn
In addition to the main photometric monitoring we carried out in the Landolt B V R I bands, with data and light curves presented in Table 1 and Fig. 1, we also obtained a lower amount of observations in the SLOAN g r i bands, which are listed in the table below.
Our g r i photometry of AT 2023txn.
Appendix C: Log of spectroscopic observations
The table below presents the log of our spectroscopic observations of AT 2023txn, obtained with three telescopes: the Asiago 1.22m + B&C, Asiago 1.82m + REOSC Echelle, and Varese 0.84m + Multi-Mode Spectrograph. The MMS was operated both in the Echelle and in the low-resolution modes.
Journal of the spectroscopic observations of AT 2023txn.
All Tables
Detection of AT 2023txn on DASCH digitization of Harvard historical photographic plates.
All Figures
|
Fig. 1. ANS Collaboration B V R I photometry (in magnitudes) of AT 2023txn over 2023-2025. The Hα panel shows the integrated flux (in erg cm−2 s−1) of the Hα emission line measured on the nine Asiago 1.22m + B&C spectra presented in Fig. 2 and on a spectrum obtained on 2025-06-25 with the Varese 0.84m telescope (plotted as an open circle). |
| In the text | |
|
Fig. 2. Spectroscopic evolution of AT 2023txn as tracked with the Asiago 1.22m + B&C telescope, from maximum brightness in October 2023 down to the center of the deep minimum in March 2025. The strongest emission lines pertain to the hydrogen Balmer series and to FeII multiplets (identified by comb-like markings). |
| In the text | |
|
Fig. 3. Top-left panel: Fully split stellar and interstellar absorption components to NaI 5890 from the Asiago 1.82m + Echelle high-resolution spectrum of AT 2023txn for 2024-01-29. Bottom-left panel: Hα profiles of AT 2023txn from the Asiago 1.82m + Echelle high-resolution spectra. Right panel: Evolution of the Hα profile on the Varese 0.84m + Echelle high-resolution spectra. All phases ϕ are computed according to Eq. (1). |
| In the text | |
|
Fig. 4. Long-term photometric evolution of AT 2023txn reconstructed by combining ZTF g r, ANS g r B and Gaia G, BP, and RP photometry (in magnitudes). Top two panels plot the IR photometry collected at six-month cadence by the NeoWISE satellite in W1 (3.4 μm) and W2 (4.6 μm) bands. The epochs of the minima are marked on the g-band panel follow Eq. (1). The minimum marked by the orange arrow is discussed in Sect. 3.4. |
| In the text | |
|
Fig. 5. Phase-reckoned photometry of AT 2023txn to highlight the modulation and minima following Eq. (1). The minimum marked by the orange arrow is discussed in Sect. 3.4. |
| In the text | |
|
Fig. 6. Fit to the Asiago 1.22m + B&C spectrum for 2025-03-02 obtained right at the center of a deep minimum. The spectrum for the scaled M6III template was obtained with the same telescope, while the bremsstrahlung radiation is computed for an electronic temperature of 104 K, and the applied reddening law is that of Fitzpatrick (1999) for the standard RV = 3 case. |
| In the text | |
|
Fig. 7. SED of AT 2023txn at the epoch of the Swift UVM2 observation (2024-01-24, close to maximum brightness) and at the center of a deep minimum (2025-03-01). The 2MASS J H K and AllWISE W1,W2 data are not simultaneous with the rest. |
| In the text | |
Current usage metrics show cumulative count of Article Views (full-text article views including HTML views, PDF and ePub downloads, according to the available data) and Abstracts Views on Vision4Press platform.
Data correspond to usage on the plateform after 2015. The current usage metrics is available 48-96 hours after online publication and is updated daily on week days.
Initial download of the metrics may take a while.