Fig. 1
Download original image
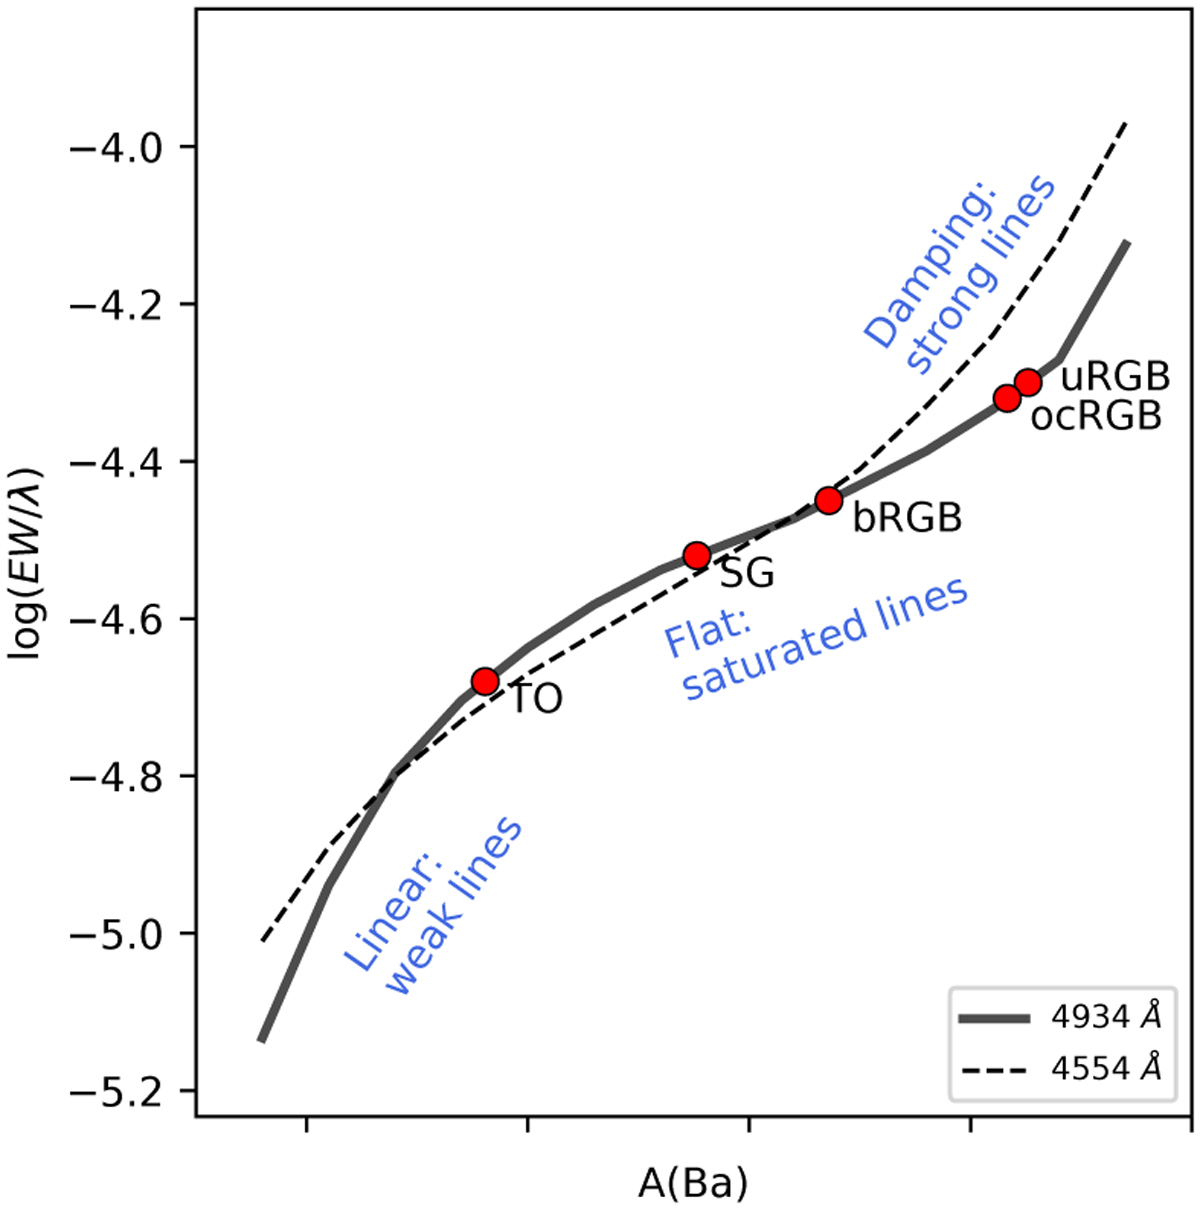
Theoretical curves of growth for the two Ba resonance lines. Equivalent widths (EW) were computed in spectra synthesised by MARCS 1D atmosphere models adopting the atmospheric parameters Teff = 5540 K, log g = 2.45, [Fe/H] = −2.00 dex, and υmic = 1.5 km s−1. The barium abundance in the horizontal axis is neglected on purpose, as the scale depends on the abundance itself and the stellar parameters. The location of our stars is indicated by the red circles, where they are designated according to their evolutionary state as follows: turn-off (TO), subgiant (SG), base of the red giant branch (bRGB), over the clump RGB (ocRGB), and upper RGB (uRGB).
Current usage metrics show cumulative count of Article Views (full-text article views including HTML views, PDF and ePub downloads, according to the available data) and Abstracts Views on Vision4Press platform.
Data correspond to usage on the plateform after 2015. The current usage metrics is available 48-96 hours after online publication and is updated daily on week days.
Initial download of the metrics may take a while.