Fig. B.1
Download original image
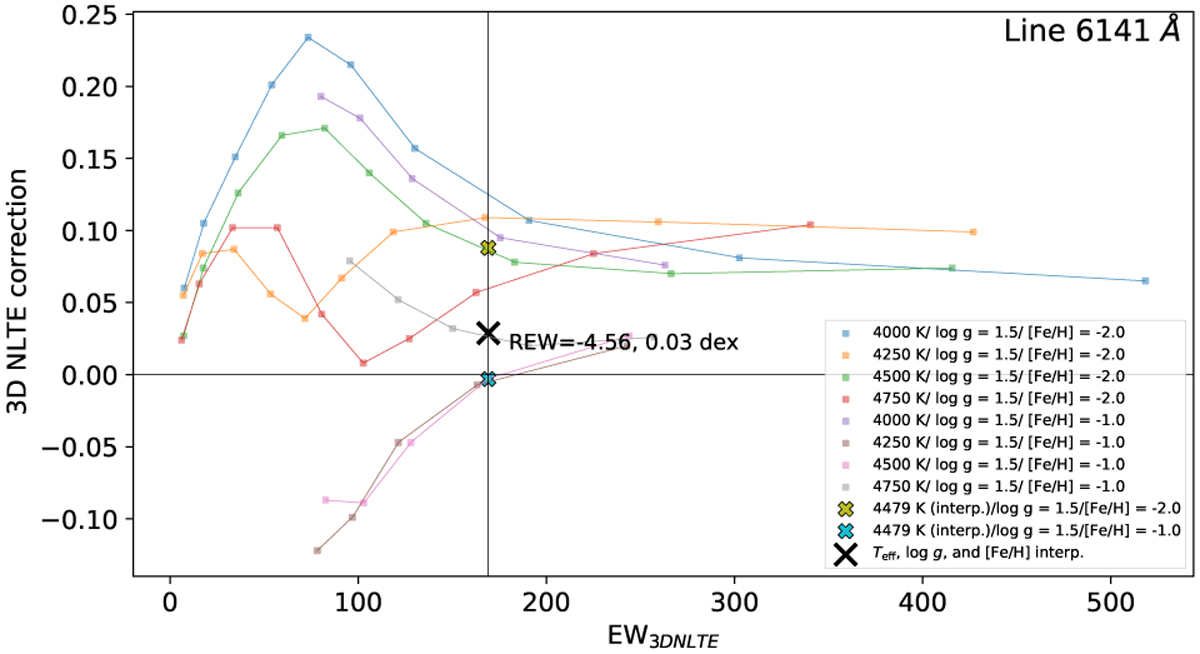
Interpolation of 3D NLTE corrections of the line at λ6141 Å for the star uRGB-2. Circles represent values listed in the original tables, the parameters of which are given in the legends. Lines, coloured the same as the circles, are linear interpolations. The crosses represent values interpolated in Teff and log g. The black cross displays the interpolated value in Teff, log g, and [Fe/H]. The REW of the line and the 3D NLTE corrections are noted in the plot.
Current usage metrics show cumulative count of Article Views (full-text article views including HTML views, PDF and ePub downloads, according to the available data) and Abstracts Views on Vision4Press platform.
Data correspond to usage on the plateform after 2015. The current usage metrics is available 48-96 hours after online publication and is updated daily on week days.
Initial download of the metrics may take a while.