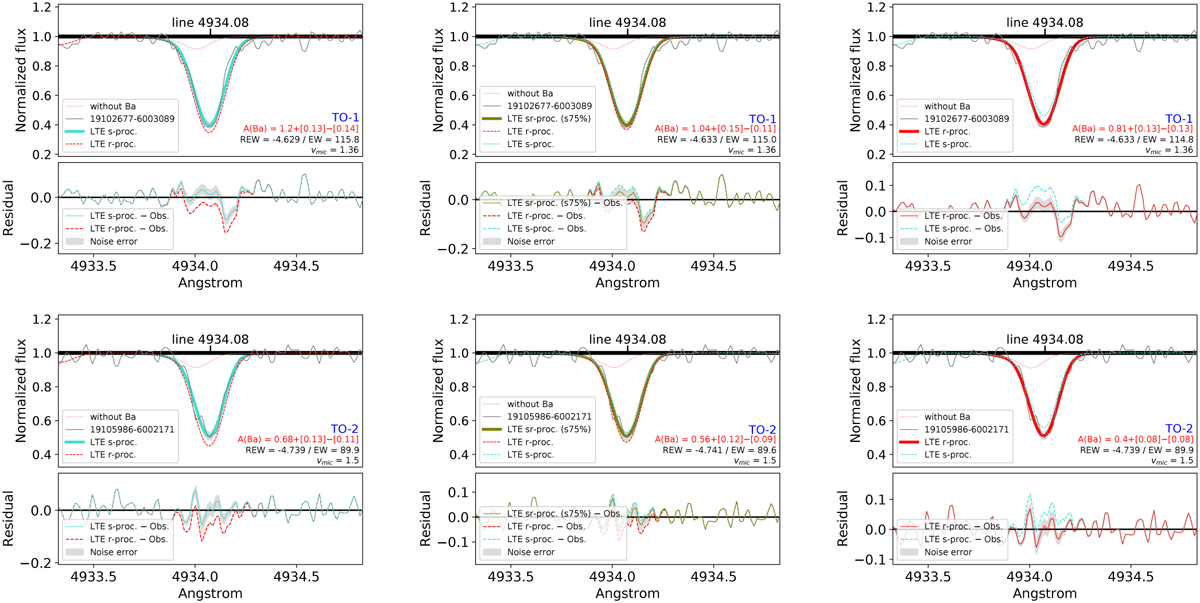
Fig. D.1
Download original image
Fits of the resonance line 4934 Å of the TO stars. Top and bottom panels correspond to the TO-1 and TO-2 star, respectively. Left, middle, and right panels show fits of 100, 75, and 0% s-process profiles, respectively. For comparison, every panel shows line profiles of s- (cyan dashed line) and r-process (red dashed line) with an abundance equal to that determined by the fits (characters in red). Residuals of the fits are shown below the main plots. Fitting errors related to the noise are covered by shades.
Current usage metrics show cumulative count of Article Views (full-text article views including HTML views, PDF and ePub downloads, according to the available data) and Abstracts Views on Vision4Press platform.
Data correspond to usage on the plateform after 2015. The current usage metrics is available 48-96 hours after online publication and is updated daily on week days.
Initial download of the metrics may take a while.