Open Access
Fig. F.1
Download original image
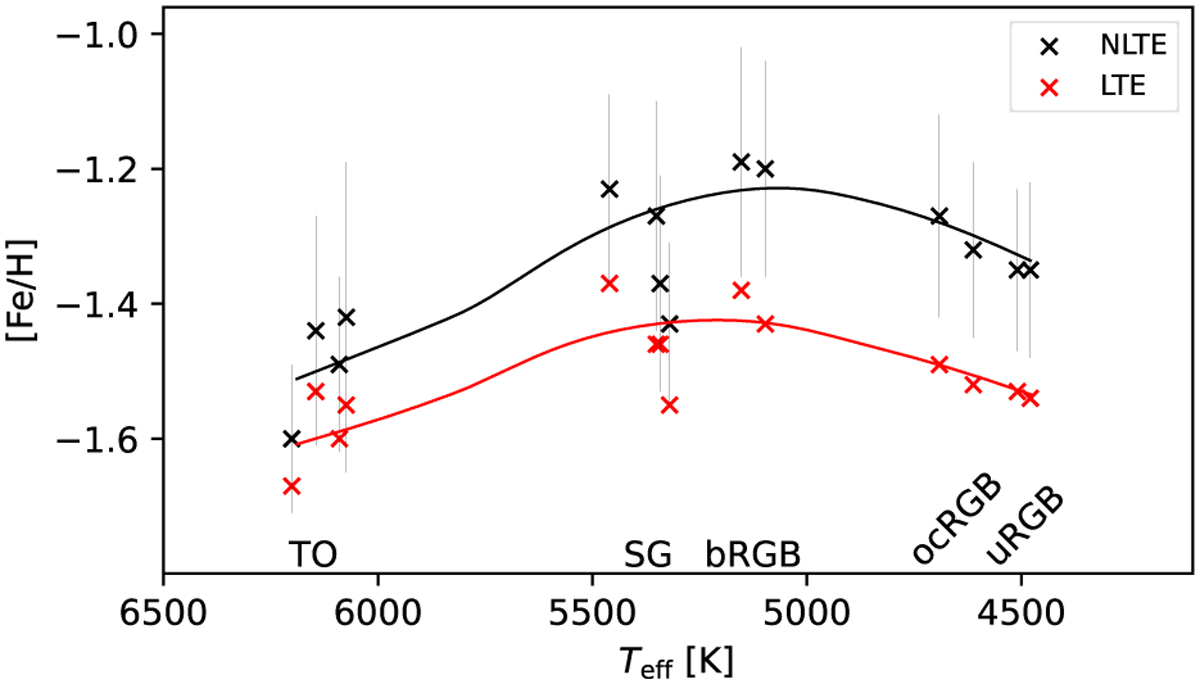
Metallicity as function of Teff. Red and black crosses represent NLTE and LTE determinations, respectively. The errors of NLTE values are represented by the black bars. Red and black curves are corresponding LOWESS regressions (TO-2 neglected). Evolutionary states are noted in the plot.
Current usage metrics show cumulative count of Article Views (full-text article views including HTML views, PDF and ePub downloads, according to the available data) and Abstracts Views on Vision4Press platform.
Data correspond to usage on the plateform after 2015. The current usage metrics is available 48-96 hours after online publication and is updated daily on week days.
Initial download of the metrics may take a while.