Fig. 5
Download original image
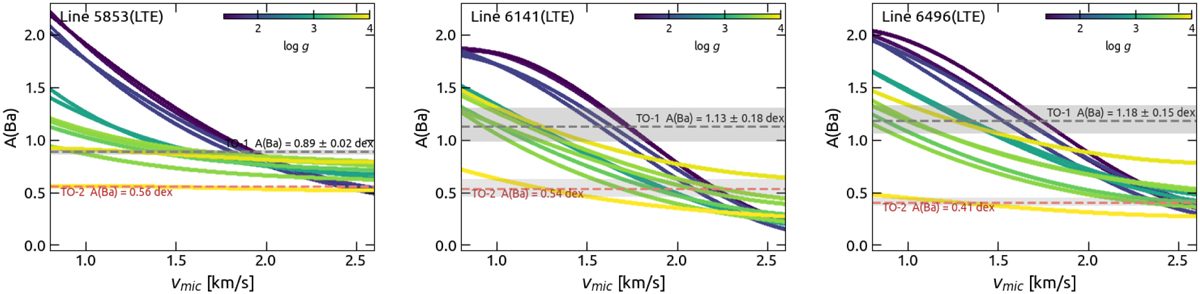
LTE barium abundance as function of υmic for the subordinate lines 5853, 6141, and 6496 Å. Each trend is related to one star and is colour-coded according to log g. Shades enclose the most probable ranges of A(Ba) of the TO-1 and TO-2 stars; see main text. Dashed gray and red lines indicate the mean A(Ba) in the shades for each star, respectively.
Current usage metrics show cumulative count of Article Views (full-text article views including HTML views, PDF and ePub downloads, according to the available data) and Abstracts Views on Vision4Press platform.
Data correspond to usage on the plateform after 2015. The current usage metrics is available 48-96 hours after online publication and is updated daily on week days.
Initial download of the metrics may take a while.