Fig. 6
Download original image
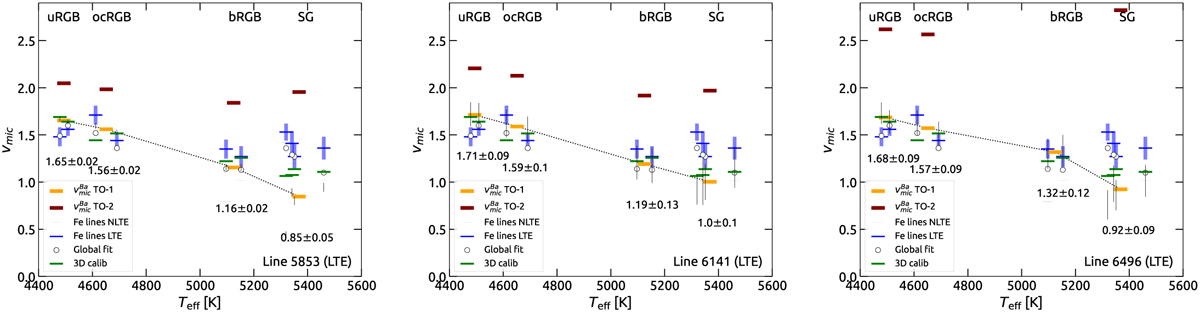
Microturbulence as function of Teff for the stars in Table 1. Panels descriptions, from left to right, are as follows. Quantities derived from the subordinate lines at λ5853, 6141, and 6496 Å, respectively. TO stars are excluded on purpose. Vertical bars represent υmic ranges computed by the intersections of the trends with the shades in Fig. 5. Orange dashes are medians of contiguous bars, which correspond to stars in the stages indicated on the top; these values are defined as ![]() . Brown dashes represent
. Brown dashes represent ![]() if it were derived using A(Ba) of the TO-2 star (red dashed line in Fig. 5). Blue dashes, gray dashes, and circles represent
if it were derived using A(Ba) of the TO-2 star (red dashed line in Fig. 5). Blue dashes, gray dashes, and circles represent ![]() ,
, ![]() , and
, and ![]() , respectively. Blue bars are the errors of
, respectively. Blue bars are the errors of ![]() . Green dashes are computed with the relation based on 3D models of Dutra-Ferreira et al. (2016).
. Green dashes are computed with the relation based on 3D models of Dutra-Ferreira et al. (2016).
Current usage metrics show cumulative count of Article Views (full-text article views including HTML views, PDF and ePub downloads, according to the available data) and Abstracts Views on Vision4Press platform.
Data correspond to usage on the plateform after 2015. The current usage metrics is available 48-96 hours after online publication and is updated daily on week days.
Initial download of the metrics may take a while.