Fig. 7
Download original image
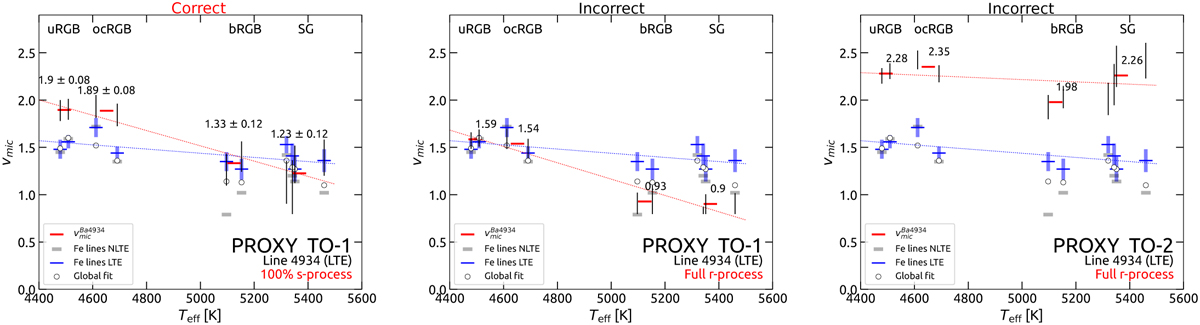
Microturbulence as function of Teff for the line 4934 Å. Left and centre panels shows quantities derived assuming 100 and 0% s-process contributions, respectively. A(Ba) = 1.15 ± 0.08 dex of the TO-1 star is assumed in both cases. Right panel shows quantities derived assuming the A(Ba) = 0.39 ± 0.08 dex and full r-process contribution of the TO-2 star. Black bars represent the microturbulence ranges required to fit observational lines with synthetic ones. Red dashes are the medians of the bars in the stages indicated on the top. The red and blue dotted lines are linear regressions of the red and blue dashes, respectively.
Current usage metrics show cumulative count of Article Views (full-text article views including HTML views, PDF and ePub downloads, according to the available data) and Abstracts Views on Vision4Press platform.
Data correspond to usage on the plateform after 2015. The current usage metrics is available 48-96 hours after online publication and is updated daily on week days.
Initial download of the metrics may take a while.