Fig. 8
Download original image
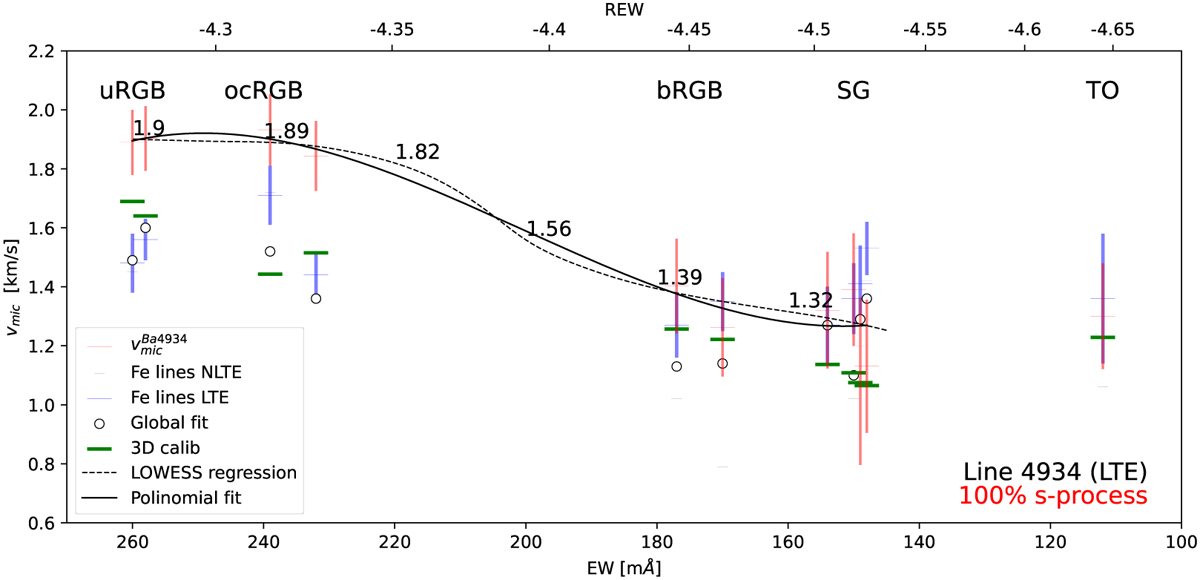
Microturbulence as function of EW and REW for the Ba resonance line at λ4934 Å. Microturbulence values determined from diverse methods are represented according to the legends. The solid black line is the polynomial regression of ![]() (Eq. (2)). The dashed line is the LOWESS regression. Microturbulence values corresponding to discrete points of the curve, separated by 20 mÅ, from 260 to 160 mÅ are noted.
(Eq. (2)). The dashed line is the LOWESS regression. Microturbulence values corresponding to discrete points of the curve, separated by 20 mÅ, from 260 to 160 mÅ are noted.
Current usage metrics show cumulative count of Article Views (full-text article views including HTML views, PDF and ePub downloads, according to the available data) and Abstracts Views on Vision4Press platform.
Data correspond to usage on the plateform after 2015. The current usage metrics is available 48-96 hours after online publication and is updated daily on week days.
Initial download of the metrics may take a while.