Fig. 9
Download original image
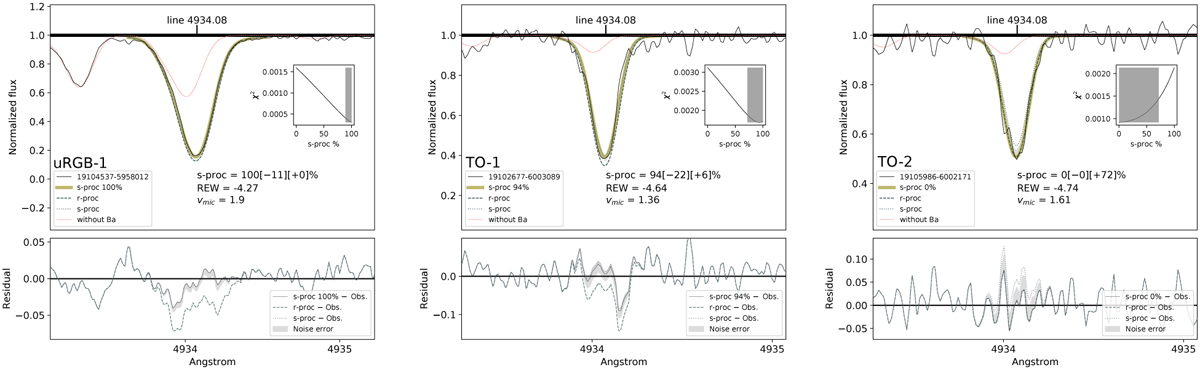
Fits of the 4934 Å Ba resonance line. The stars to which each plot corresponds are indicated in the plots. The observational profiles are represented by the black lines. Synthetic profiles are represented by coloured lines. The synthetic profiles most compatible with the observational ones are represented by the thick olive lines; their s-process contributions are noted along with the errors related to the noise. Synthetic profiles related to s- and r-processes are represented by the dotted or dashed green lines according to the legends. A synthetic spectra without barium are represented by the dotted red lines. The probability for a given process to dominate the line profile shape is given by the χ2 in the inner plot. The shades in the inner plots cover errors of the s-process contribution. Residual plots are shown at the bottom panel, where the shades represent the areas covered by the fitting errors.
Current usage metrics show cumulative count of Article Views (full-text article views including HTML views, PDF and ePub downloads, according to the available data) and Abstracts Views on Vision4Press platform.
Data correspond to usage on the plateform after 2015. The current usage metrics is available 48-96 hours after online publication and is updated daily on week days.
Initial download of the metrics may take a while.