Open Access
Fig. 5
Download original image
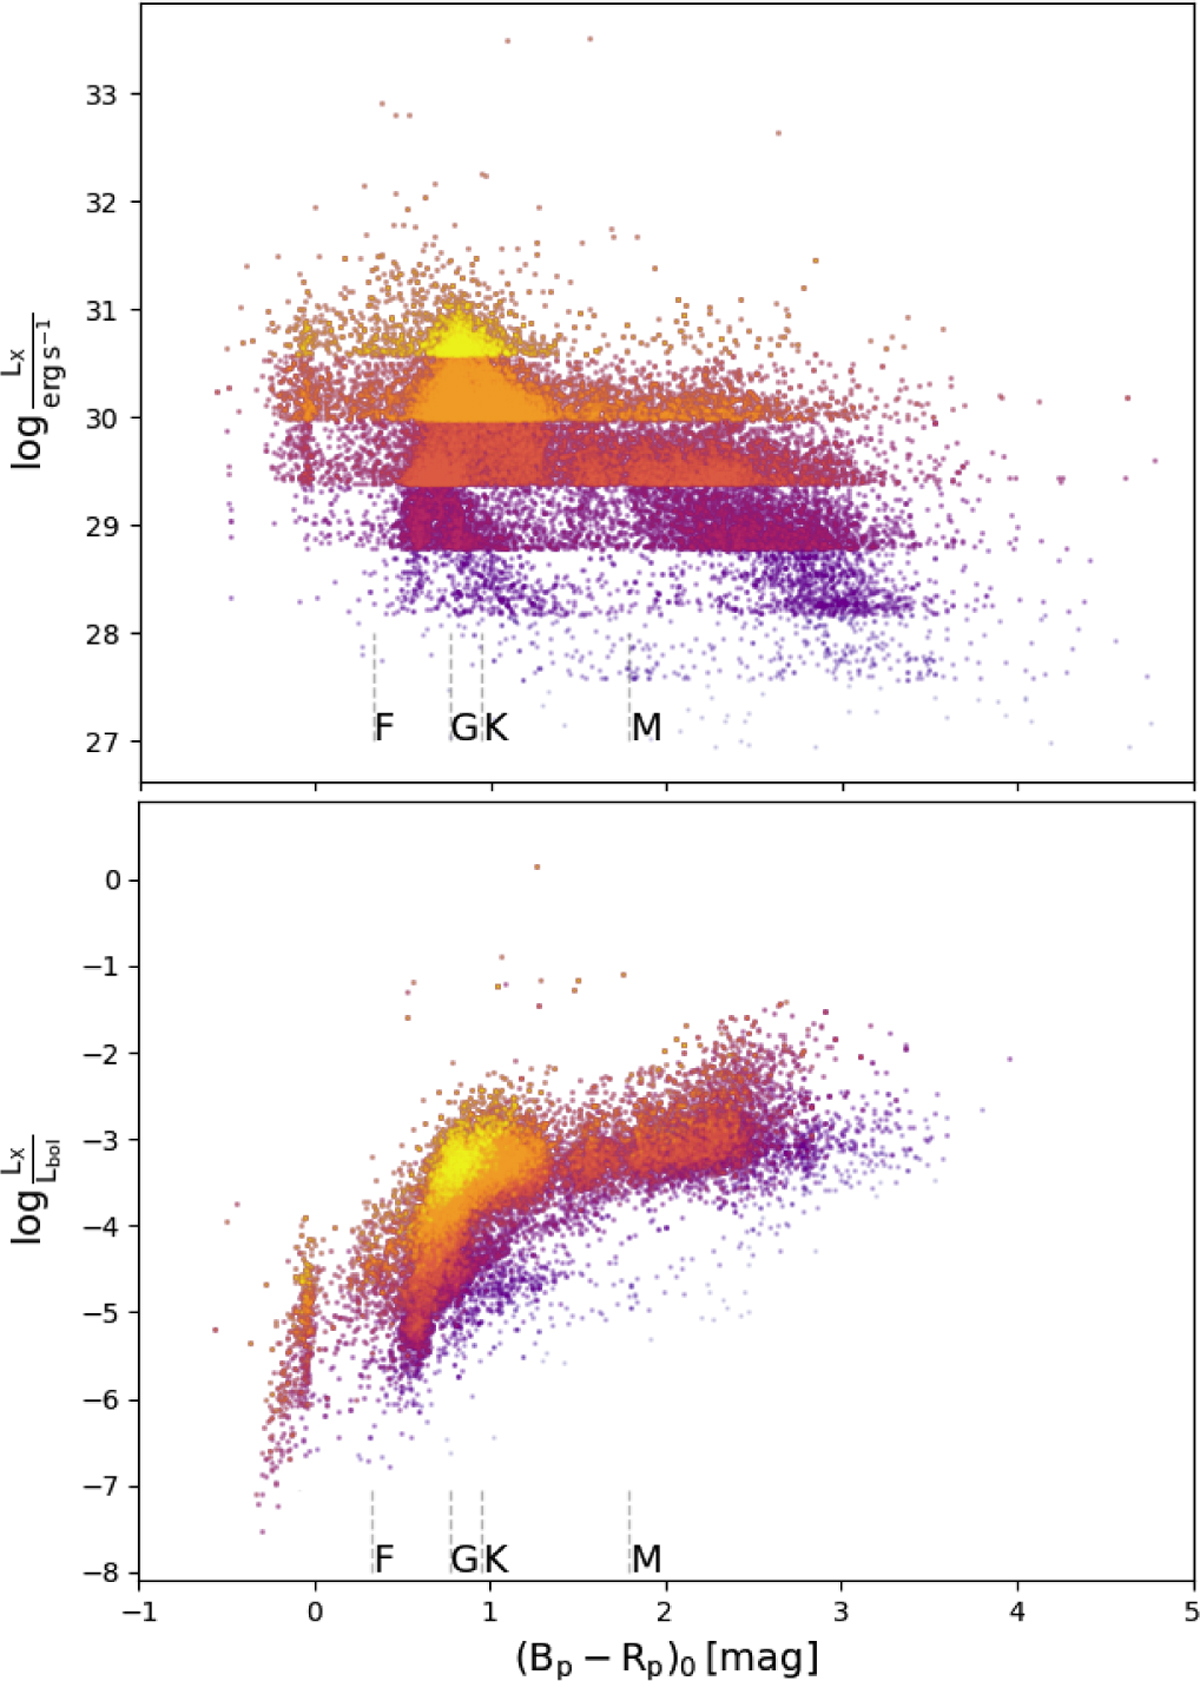
Upper panel: luminosity–color phase space of all the stars in our sample (apart from the giant group; for those, see Appendix C). Lower panel: X-ray fractional luminosity versus Gaia color. Sources without available bolometric correction were not displayed.
Current usage metrics show cumulative count of Article Views (full-text article views including HTML views, PDF and ePub downloads, according to the available data) and Abstracts Views on Vision4Press platform.
Data correspond to usage on the plateform after 2015. The current usage metrics is available 48-96 hours after online publication and is updated daily on week days.
Initial download of the metrics may take a while.