Fig. 10.
Download original image
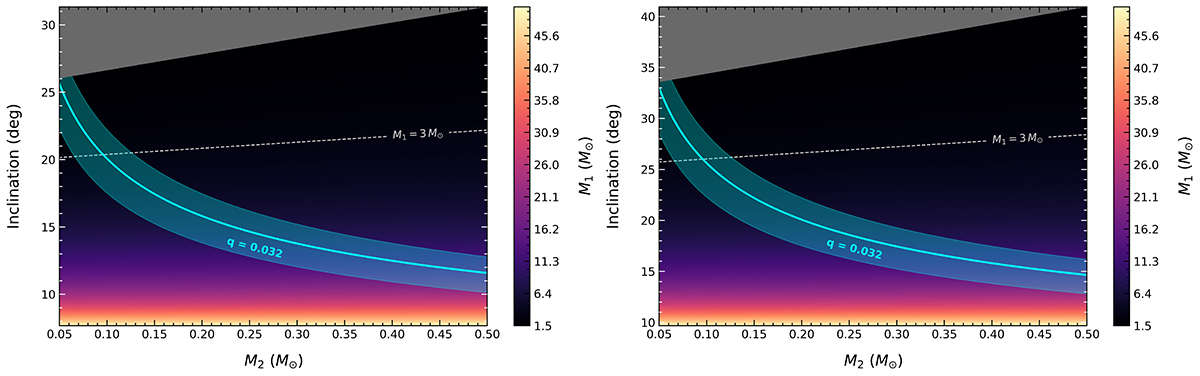
Relationship between the orbital inclination and the mass of the donor star (M2), with the mass of the compact object (M1) represented by colour, for orbital periods of 2.25 (left) and 4.50 h (right). The solid cyan line and cyan shaded area correspond to a mass ratio of 0.032 and its uncertainty, respectively. The light grey dashed line marks M1 = 3 M⊙, and the dark grey triangular areas correspond to M1 < 1.5 M⊙.
Current usage metrics show cumulative count of Article Views (full-text article views including HTML views, PDF and ePub downloads, according to the available data) and Abstracts Views on Vision4Press platform.
Data correspond to usage on the plateform after 2015. The current usage metrics is available 48-96 hours after online publication and is updated daily on week days.
Initial download of the metrics may take a while.