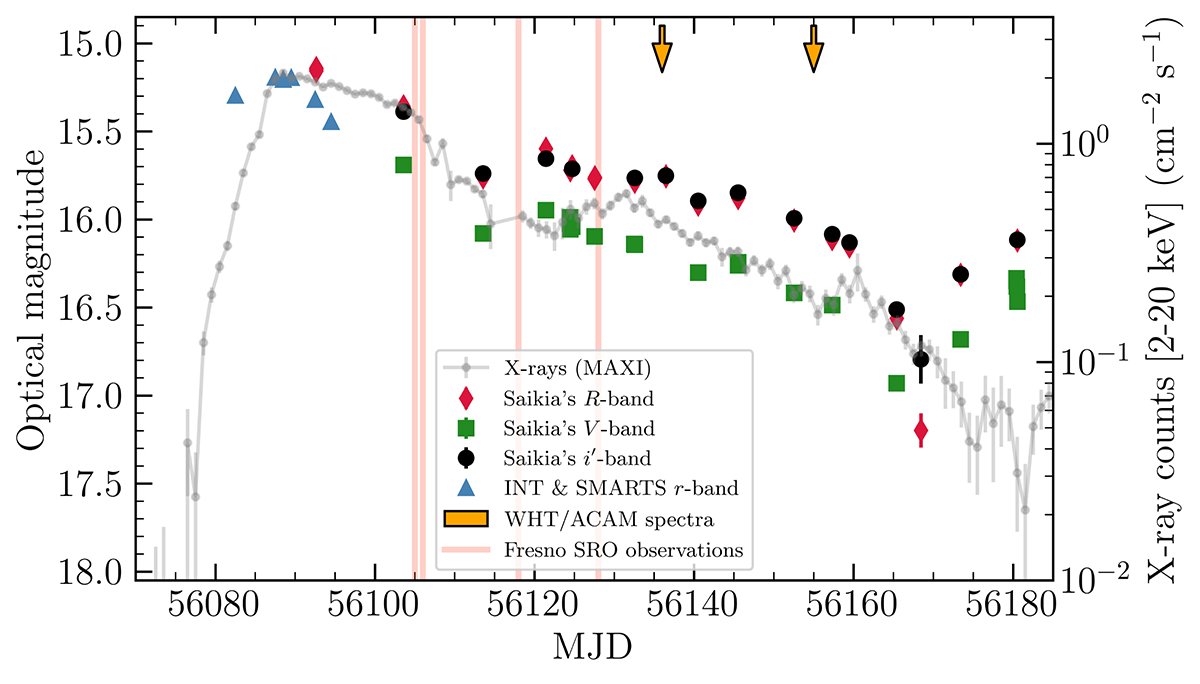
Fig. 2.
Download original image
Evolution of the 2012 outburst. X-ray data are shown as a grey line, while the R-, V-, and i′-band magnitudes published by Saikia et al. 2023a are represented by red diamonds, green squares, and black circles, respectively. Time-series photometry obtained with the SMARTS 0.9-m and INT/WFC in the r-band is marked with blue triangles, whereas the time of the WHT/ACAM spectra are indicated by orange arrows. Clear-filter photometry from Fresno SRO is marked by vertical red lines.
Current usage metrics show cumulative count of Article Views (full-text article views including HTML views, PDF and ePub downloads, according to the available data) and Abstracts Views on Vision4Press platform.
Data correspond to usage on the plateform after 2015. The current usage metrics is available 48-96 hours after online publication and is updated daily on week days.
Initial download of the metrics may take a while.