Fig. 3.
Download original image
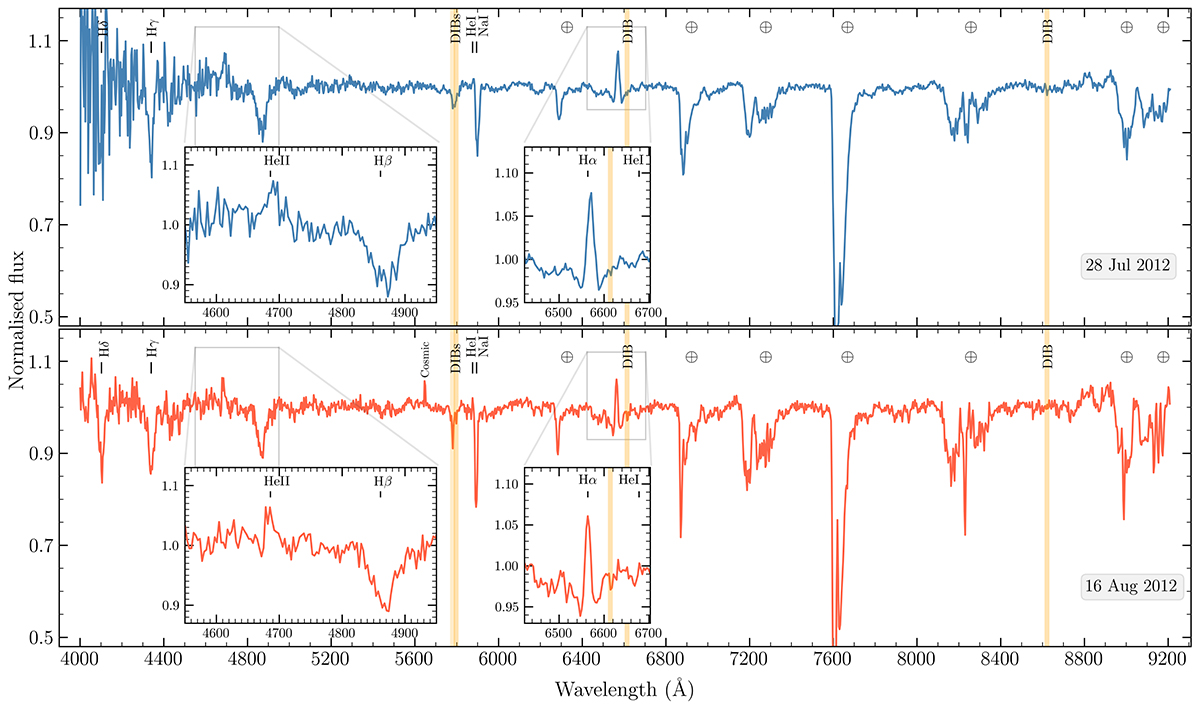
Average spectra of J1910 during outburst from the first (upper; blue) and second (lower; red) nights, obtained with ACAM after continuum normalisation. The Balmer series down to Hδ is visible, exhibiting both emission and absorption components. Zoomed-in regions show the areas around Hα and Hβ. He I and He II lines are also present and identified in the spectra, along with several diffuse interstellar bands marked with orange bars.
Current usage metrics show cumulative count of Article Views (full-text article views including HTML views, PDF and ePub downloads, according to the available data) and Abstracts Views on Vision4Press platform.
Data correspond to usage on the plateform after 2015. The current usage metrics is available 48-96 hours after online publication and is updated daily on week days.
Initial download of the metrics may take a while.