Fig. 6.
Download original image
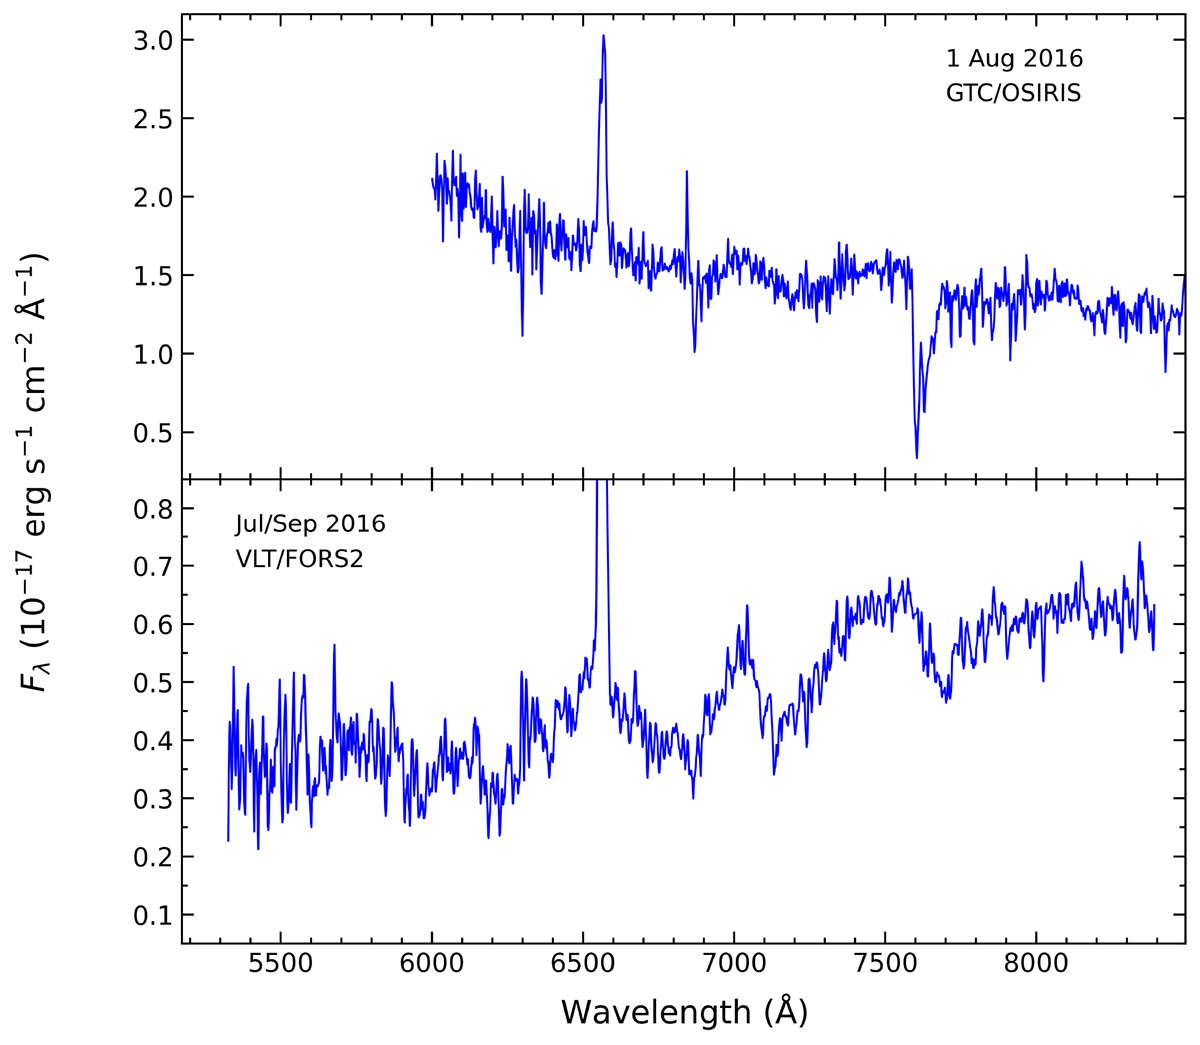
Top panel: Average GTC/OSIRIS spectrum of J1910 during quiescence. The bluer part has been trimmed due to unreliable correction for the instrumental response. Although veiled by slit contamination from the two nearby stars (see Fig. 1), caused by seeing ≳1″, TiO absorption bands characteristic of M-stars are present in the 6800−7200 Å wavelength range. Bottom panel: The detection of an M-star donor is confirmed by the telluric-corrected, average VLT/FORS2 spectrum also obtained during quiescence. Both average spectra were dereddened using E(B − V) = 0.6 (see Sect. 3.4), and the FORS2 spectrum was smoothed with a Savitzky-Golay filter, employing a window length of nine data points and a third-order fitting polynomial for illustrative purposes.
Current usage metrics show cumulative count of Article Views (full-text article views including HTML views, PDF and ePub downloads, according to the available data) and Abstracts Views on Vision4Press platform.
Data correspond to usage on the plateform after 2015. The current usage metrics is available 48-96 hours after online publication and is updated daily on week days.
Initial download of the metrics may take a while.