Fig. 7.
Download original image
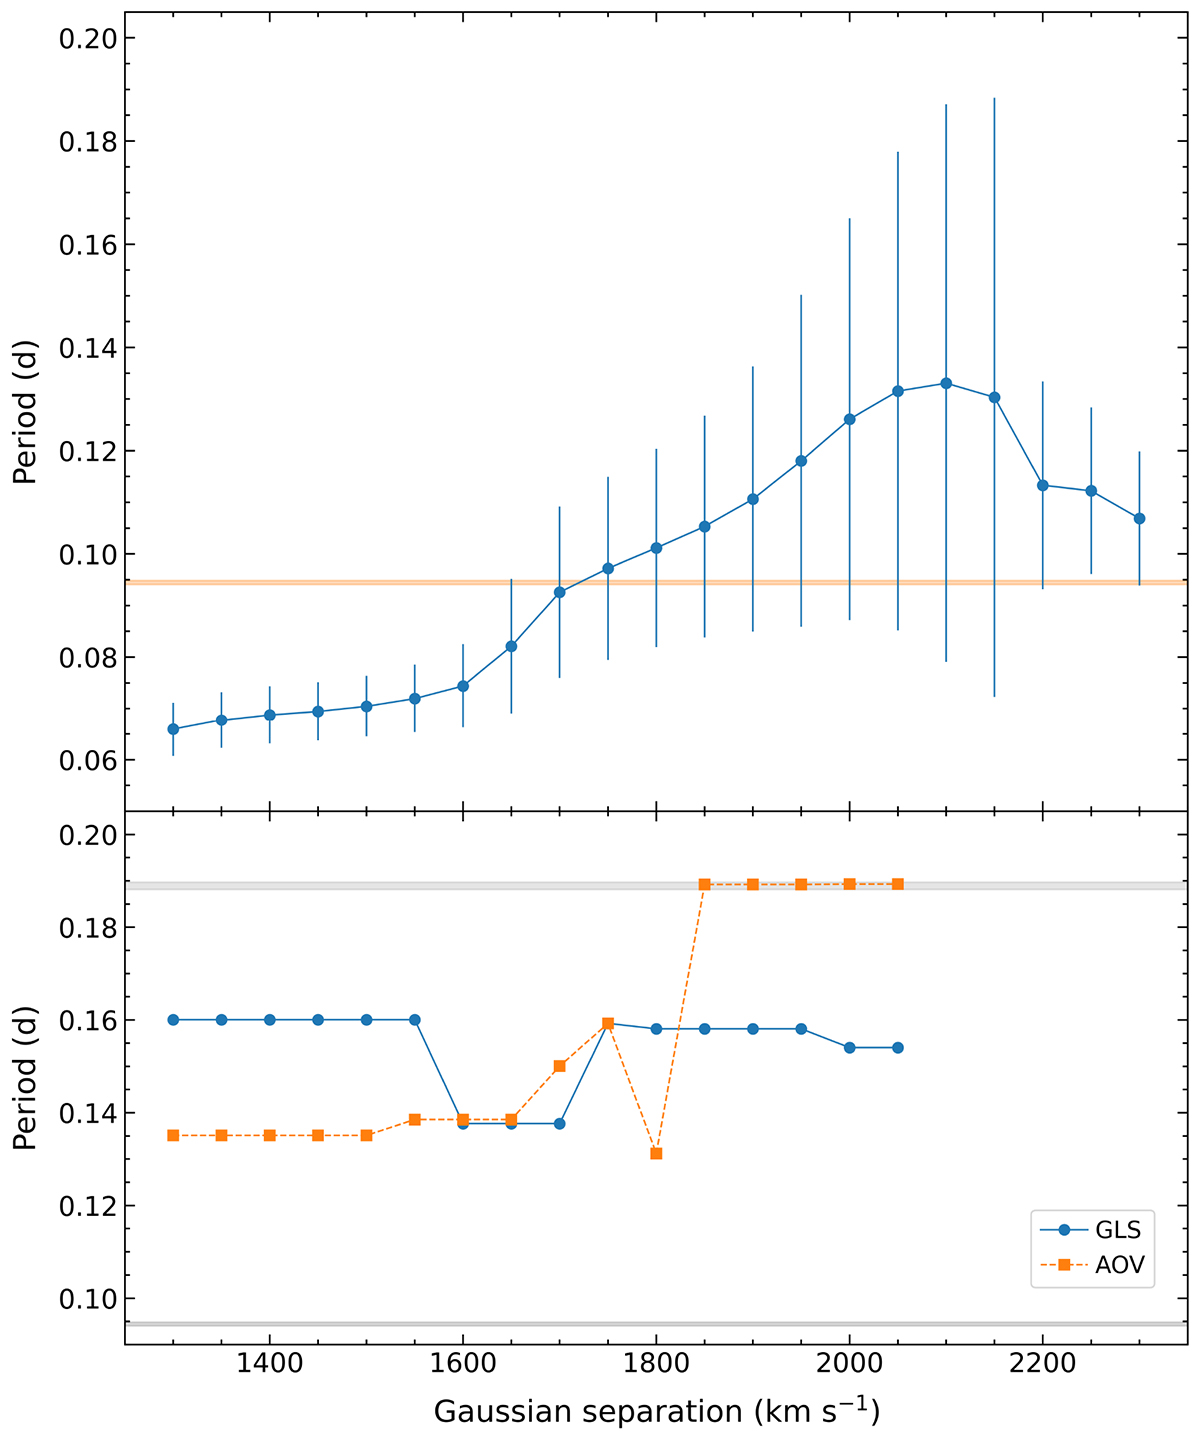
Top panel: Best sine-fit periods derived from the radial velocity curves of the Hα emission line in the OSIRIS spectra, as a function of the double-Gaussian separation used in the velocity extraction. The shaded horizontal band indicates the periods derived from the light curves. Error bars represent 1σ uncertainties. Bottom panel: Periods corresponding to the highest peaks in the GLS (blue circles) and AOV (orange squares) periodograms derived from the quiescent FORS2 Hα radial velocity curves, as a function of the Gaussian separation used to extract the velocities. The period search was restricted to the range 0.068−0.25 d. The lower shaded horizontal band marks the periods observed in the photometric light curves, while the upper band corresponds to twice these values.
Current usage metrics show cumulative count of Article Views (full-text article views including HTML views, PDF and ePub downloads, according to the available data) and Abstracts Views on Vision4Press platform.
Data correspond to usage on the plateform after 2015. The current usage metrics is available 48-96 hours after online publication and is updated daily on week days.
Initial download of the metrics may take a while.