Fig. 2.
Download original image
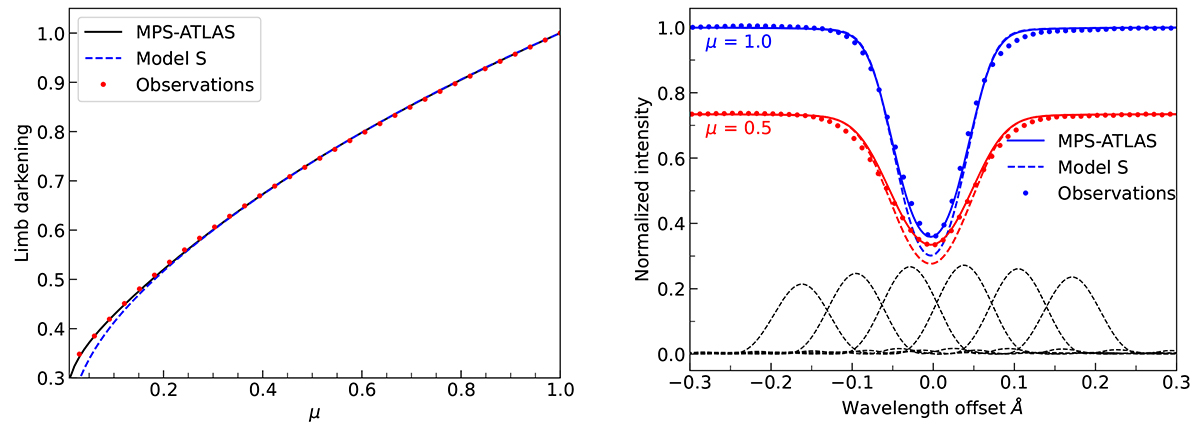
Background intensity computed from the MPS-ATLAS solar model atmosphere (solid), the standard solar Model S (dashed), and from the observations (dots). Left: Limb darkening (Ic(μ)/Ic(μ = 1)) in the continuum around the HMI line compared with the observations from Neckel & Labs (1994). Right: Synthesized FeI spectral line background intensity (![]() ) compared with the observations from the IAG spectral atlas (Ellwarth et al. 2023) at μ = 1 (blue) and μ = 0.5 (red). The wavelength offset is with respect to the center of the HMI line λHMI = 6173.33 Å. The black dashed curves represent the six HMI filtergrams.
) compared with the observations from the IAG spectral atlas (Ellwarth et al. 2023) at μ = 1 (blue) and μ = 0.5 (red). The wavelength offset is with respect to the center of the HMI line λHMI = 6173.33 Å. The black dashed curves represent the six HMI filtergrams.
Current usage metrics show cumulative count of Article Views (full-text article views including HTML views, PDF and ePub downloads, according to the available data) and Abstracts Views on Vision4Press platform.
Data correspond to usage on the plateform after 2015. The current usage metrics is available 48-96 hours after online publication and is updated daily on week days.
Initial download of the metrics may take a while.