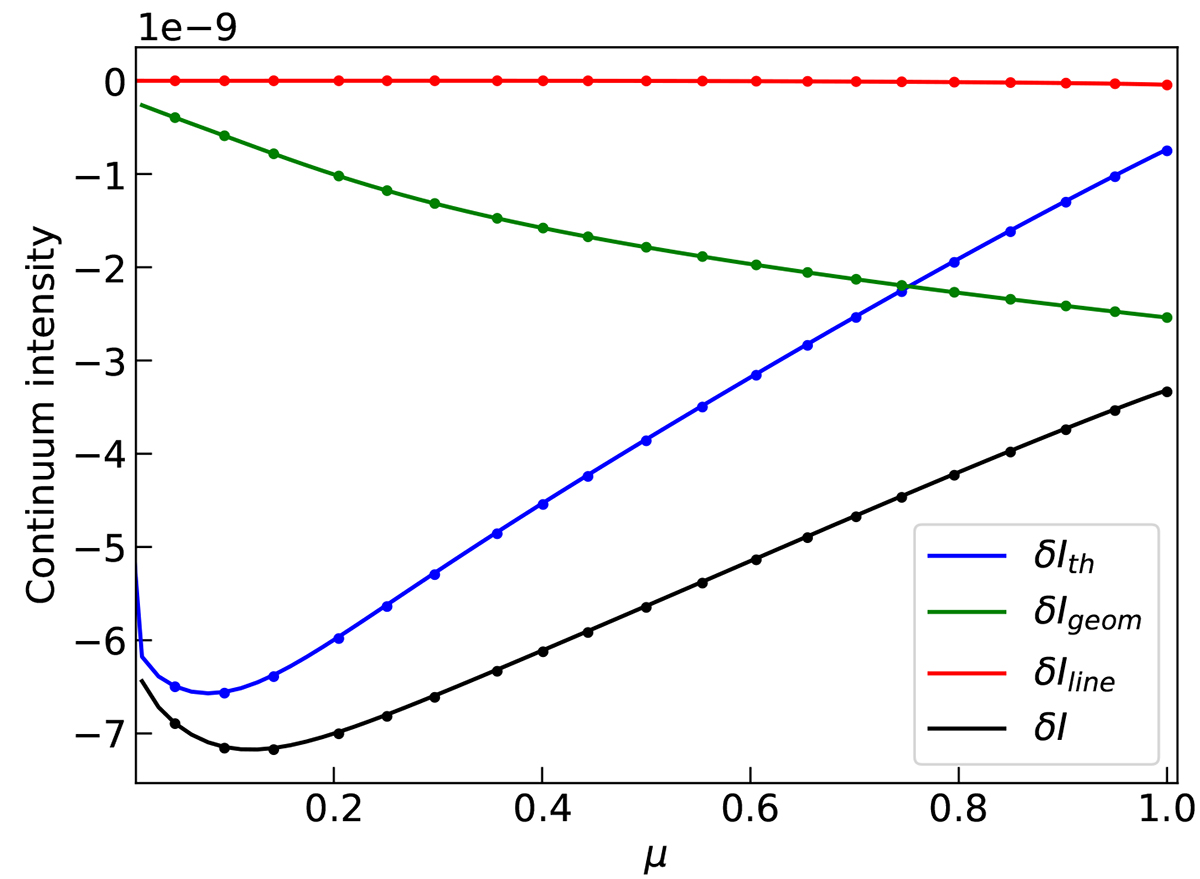
Fig. A.1.
Download original image
Test of the direct computation of continuum intensity (dots) as a function μ and comparison with the first-order computation (solid line). The thermodynamical, geometrical, and line contributions are represented separately in blue, green, and red respectively while the full intensity is in black. The wavelength offset is with respect to the center of the HMI line λHMI = 6173.33 Å.
Current usage metrics show cumulative count of Article Views (full-text article views including HTML views, PDF and ePub downloads, according to the available data) and Abstracts Views on Vision4Press platform.
Data correspond to usage on the plateform after 2015. The current usage metrics is available 48-96 hours after online publication and is updated daily on week days.
Initial download of the metrics may take a while.