Fig. 3.
Download original image
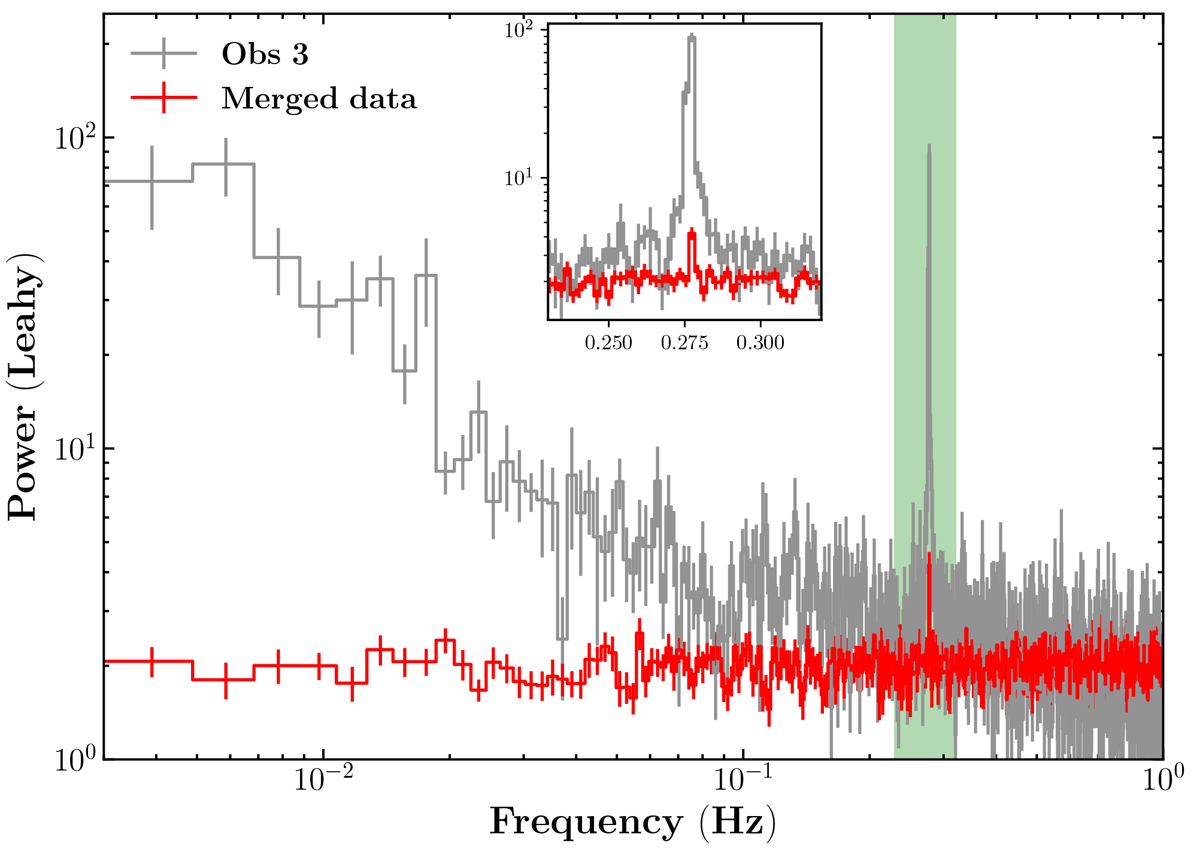
PDSs of 4U 0115+63 normalized as in Leahy et al. (1983) and obtained using 0.1 s binned, background-subtracted light curves. The gray step line represents the PDS from Obs3, which clearly shows a red noise component at low frequencies. The red step line corresponds to the PDS from the combined light curves of Obs1, Obs2, and Obs2016, which exhibits a flat (white noise) distribution in the 0.003−1 Hz range. The inset provides a zoomed-in view around the NS spin frequency (highlighted by the green stripe).
Current usage metrics show cumulative count of Article Views (full-text article views including HTML views, PDF and ePub downloads, according to the available data) and Abstracts Views on Vision4Press platform.
Data correspond to usage on the plateform after 2015. The current usage metrics is available 48-96 hours after online publication and is updated daily on week days.
Initial download of the metrics may take a while.