Fig. 5.
Download original image
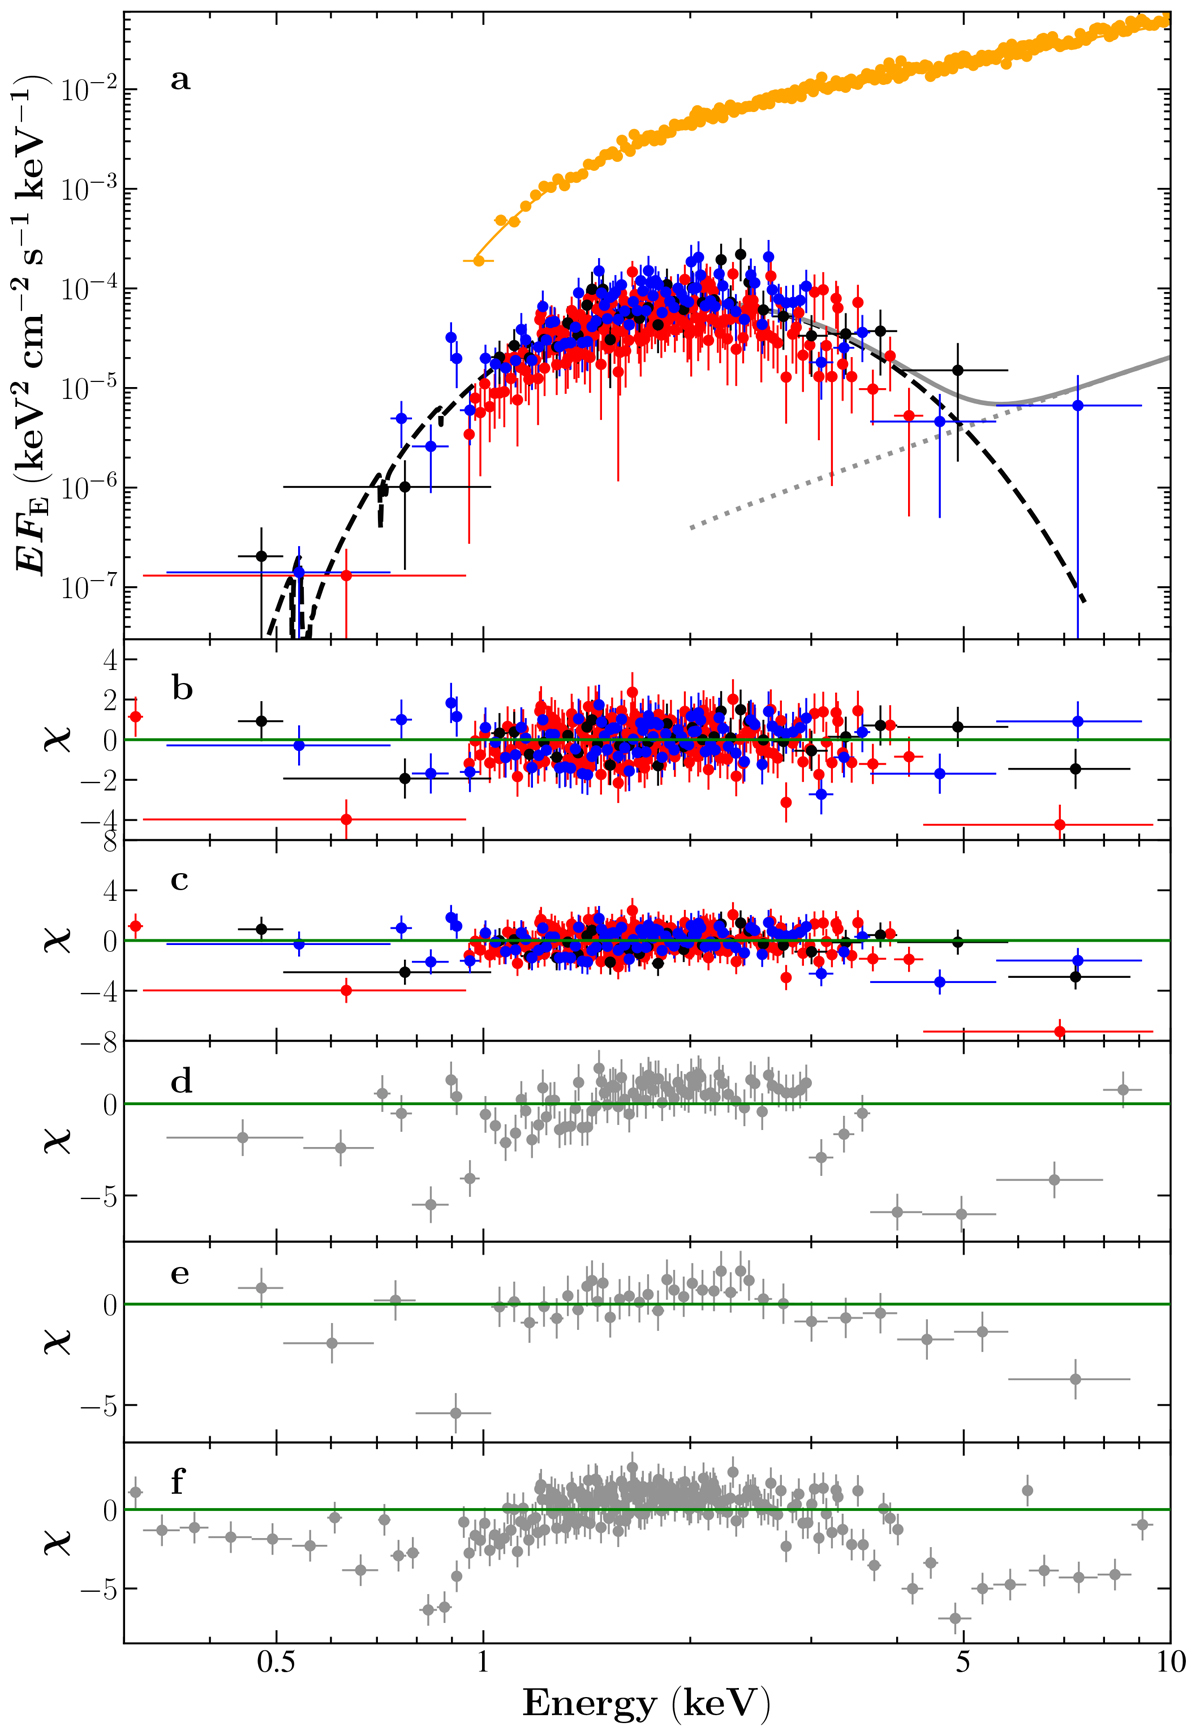
Spectral energy distribution of 4U 0115+63. Panel (a): Unfolded EFE spectra during XMM-Newton observations Obs1 (black), Obs2 (blue), and Obs2016 (red) and fitted jointly. The dashed black curve represents the bbodyrad component. The dotted gray line shows a possible additional hard component, and the solid gray line indicates the total model spectrum. As a comparison, the spectrum of Obs3 is also in orange, and its low-energy part (< 1 keV) is excluded to simplify the panel. Residuals from the spectral fits using the bbodyrad and the bbodyrad + gaussian models are shown in panels (b) and (c), respectively. Panels (d), (e), and (f) show the residuals for Obs1, Obs2, and Obs2016, respectively, using the pegpwrlw model.
Current usage metrics show cumulative count of Article Views (full-text article views including HTML views, PDF and ePub downloads, according to the available data) and Abstracts Views on Vision4Press platform.
Data correspond to usage on the plateform after 2015. The current usage metrics is available 48-96 hours after online publication and is updated daily on week days.
Initial download of the metrics may take a while.