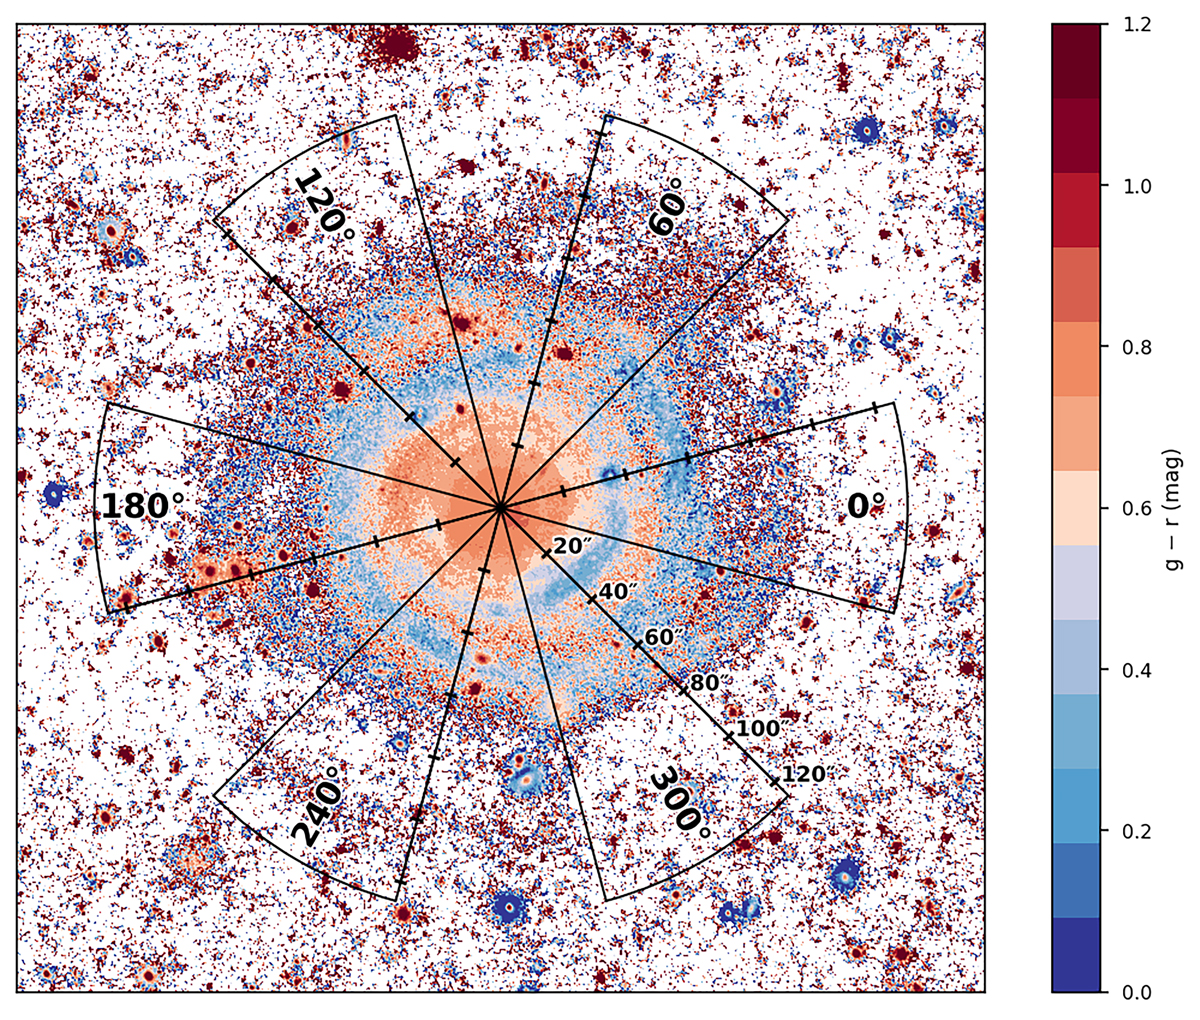
Fig. C.1.
Download original image
Two-dimensional g − r color map of Malin 2 obtained from the TTT data. The color map is smoothed by a Gaussian with sigma of 1 pixel (0.194″) for a better visualization of the LSB features. The black solid lines show the wedge positions used for the photometry in Sect. 3.2. Six wedges, each with 30° opening angles are positioned at 0°, 60°, 120°, 180°, 240°, and 300°. A radial scale bar (in units of arcsec) is also shown along each wedge for easier comparison with the radial profiles from Sect. 3.2.
Current usage metrics show cumulative count of Article Views (full-text article views including HTML views, PDF and ePub downloads, according to the available data) and Abstracts Views on Vision4Press platform.
Data correspond to usage on the plateform after 2015. The current usage metrics is available 48-96 hours after online publication and is updated daily on week days.
Initial download of the metrics may take a while.