Fig. 3.
Download original image
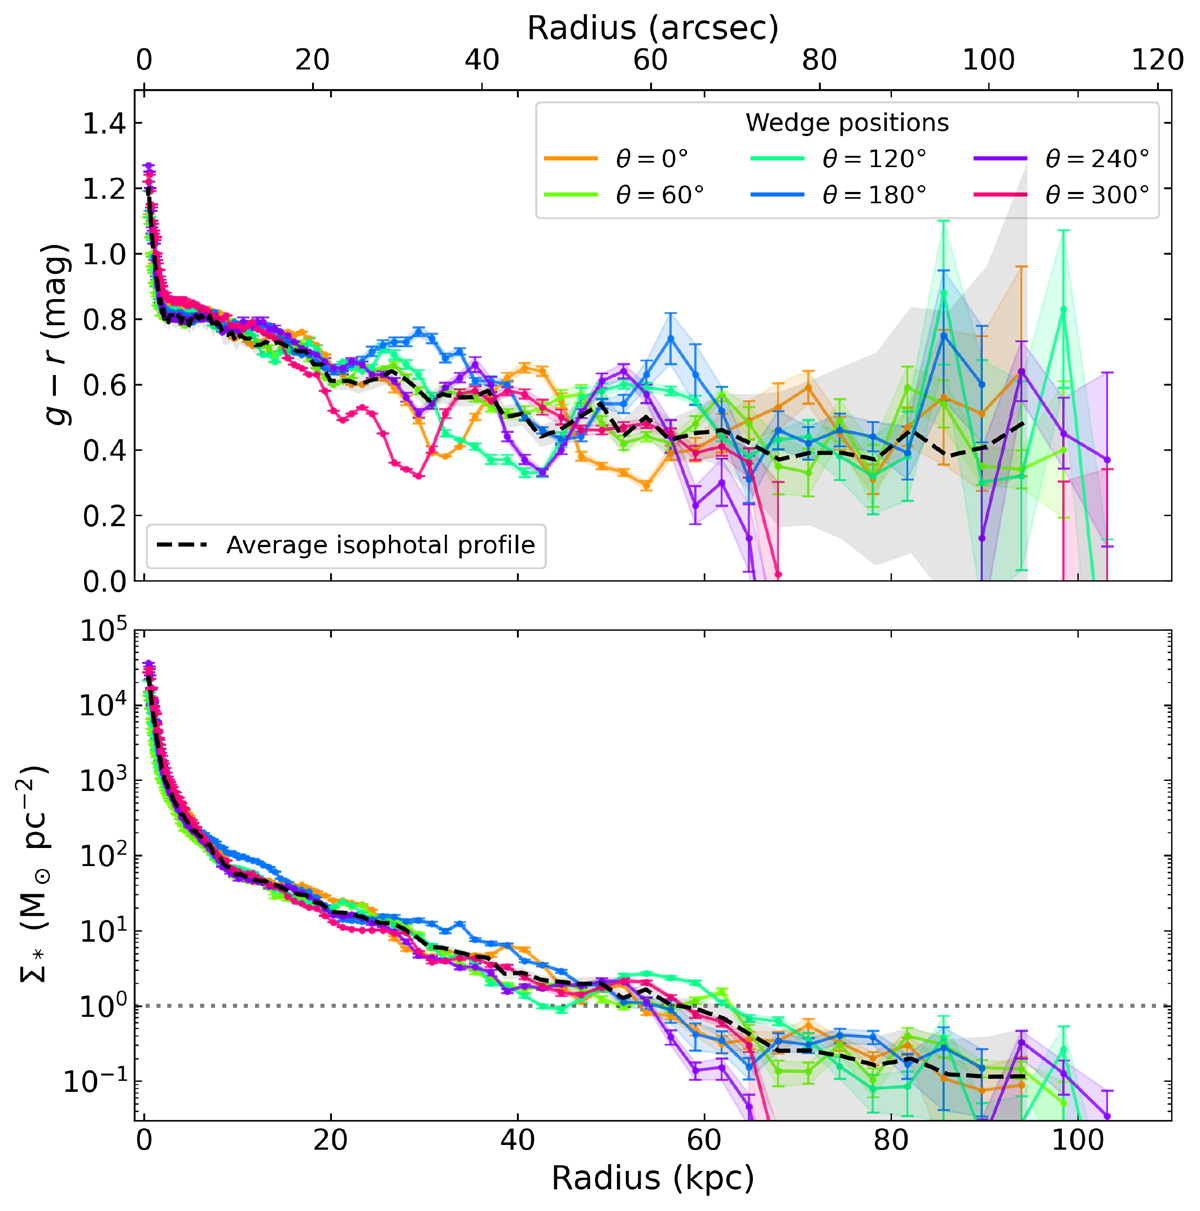
Radial profiles of g − r color (top) and stellar mass surface density, Σ* (bottom), for each wedge direction in Malin 2. The horizontal dotted line in the bottom panel marks 1 M⊙ pc−2 stellar mass surface density, where we estimated the R1 radius in the manner discussed in Sect. 3.4. The colored legends for the wedge profiles are the same as in Fig. 2. The dashed black line is the classical azimuthally averaged isophotal profile we measure, while the shaded gray region is its uncertainty.
Current usage metrics show cumulative count of Article Views (full-text article views including HTML views, PDF and ePub downloads, according to the available data) and Abstracts Views on Vision4Press platform.
Data correspond to usage on the plateform after 2015. The current usage metrics is available 48-96 hours after online publication and is updated daily on week days.
Initial download of the metrics may take a while.