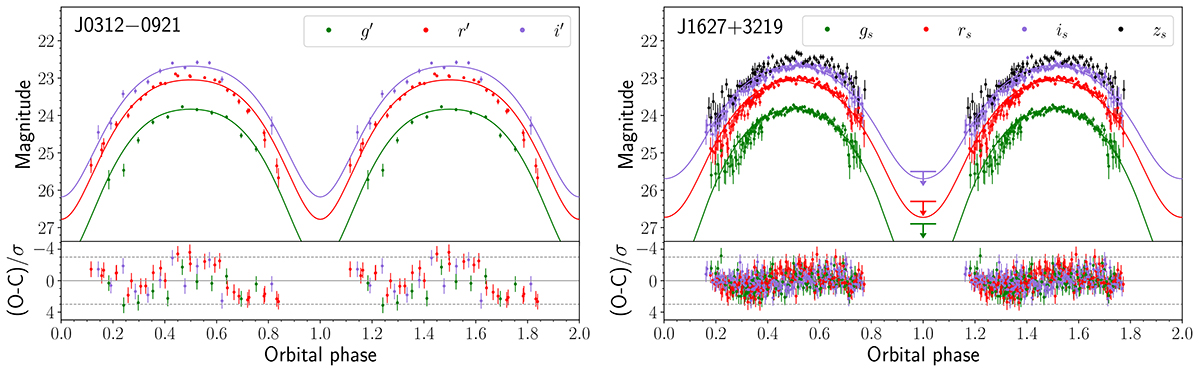
Fig. 2.
Download original image
Light curves of J0312 (left) and J1627 (right) folded with the orbital periods and the best-fitting models (solid lines). Two periods are shown for clarity. The orbital phases ϕ = 0.0 correspond to the minima of the models’ brightness. Panels show residuals calculated as the difference between the observed (O) and calculated (C) magnitudes for each data point in terms of the magnitude error, σ. Dashed lines correspond to 3σ levels.
Current usage metrics show cumulative count of Article Views (full-text article views including HTML views, PDF and ePub downloads, according to the available data) and Abstracts Views on Vision4Press platform.
Data correspond to usage on the plateform after 2015. The current usage metrics is available 48-96 hours after online publication and is updated daily on week days.
Initial download of the metrics may take a while.