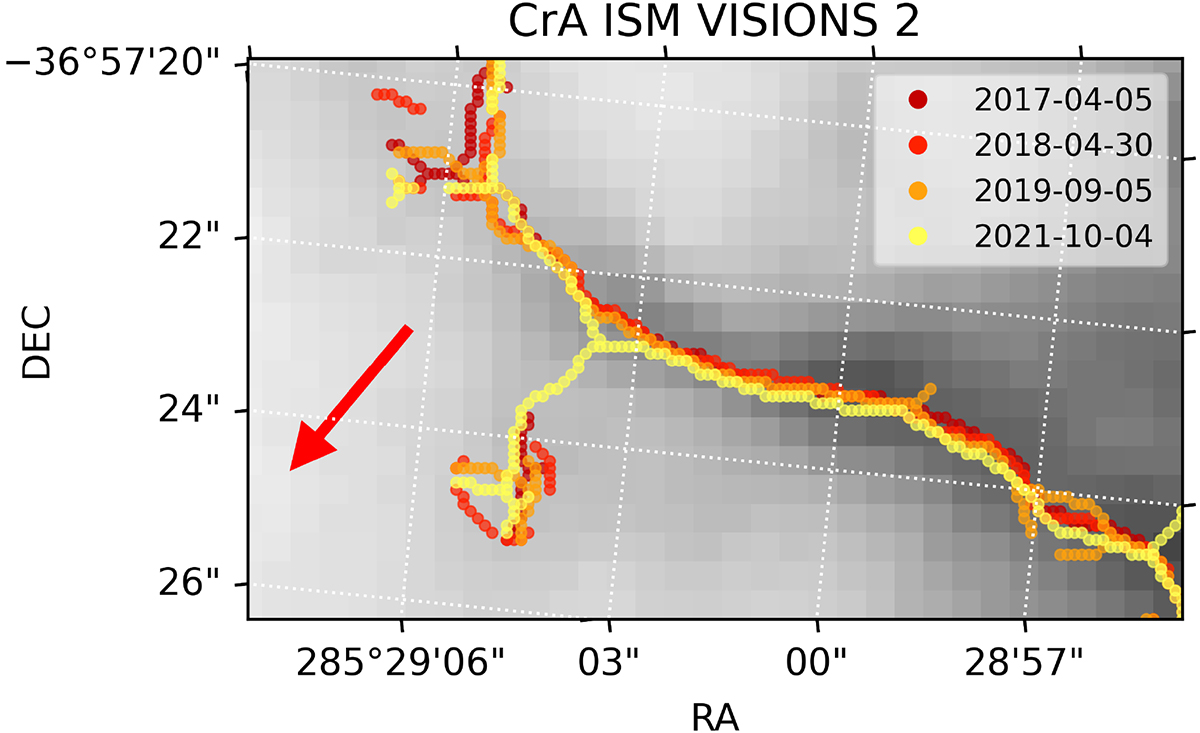
Fig. 2.
Download original image
Visualisation of the gas proper motion for CrA ISM VISIONS 2. We computed the density peaks along the ISM structure (skeletons) across four epochs between 2017 and 2021 (including CrA_wide_1_4_3_C and CrA_wide_1_4_3_F), and overlaid them on the image from the first epoch. The red arrow shows the direction of motion derived using the methods described in Sect. 3.
Current usage metrics show cumulative count of Article Views (full-text article views including HTML views, PDF and ePub downloads, according to the available data) and Abstracts Views on Vision4Press platform.
Data correspond to usage on the plateform after 2015. The current usage metrics is available 48-96 hours after online publication and is updated daily on week days.
Initial download of the metrics may take a while.