| Issue |
A&A
Volume 702, October 2025
|
|
|---|---|---|
| Article Number | L1 | |
| Number of page(s) | 7 | |
| Section | Letters to the Editor | |
| DOI | https://doi.org/10.1051/0004-6361/202556622 | |
| Published online | 26 September 2025 | |
Direct measurement of ISM proper motion with image registration
University of Vienna, Department of Astrophysics, Türkenschanzstrasse 17, 1180 Vienna, Austria
⋆ Corresponding author: This email address is being protected from spambots. You need JavaScript enabled to view it.
Received:
28
July
2025
Accepted:
3
September
2025
Abstract
To date, the quantification of the on-sky motion for interstellar clouds has relied on proxies such as young stellar objects (YSOs) and masers. We present the first direct measurement of an interstellar cloud proper motion using the VISTA Star Formation Atlas (VISIONS) multi-epoch infrared images of the Corona Australis star-forming region. Proper motions are extracted by tracking the morphology of extended structures in the cloud complex based on image registration techniques implemented in SimpleITK. Our determined values (μα* ∼ +15 mas yr−1, μδ ∼ −30 mas yr−1) are in good agreement with those obtained for YSOs and young stellar clusters in the region. This study demonstrates the potential of image registration for directly mapping the kinematics of nearby molecular clouds, opening a new window into the study of cloud dynamics.
Key words: ISM: clouds / ISM: kinematics and dynamics / ISM: structure / ISM: individual objects: Corona Australis
© The Authors 2025
 Open Access article, published by EDP Sciences, under the terms of the Creative Commons Attribution License (https://creativecommons.org/licenses/by/4.0), which permits unrestricted use, distribution, and reproduction in any medium, provided the original work is properly cited.
This article is published in open access under the Subscribe to Open model. This email address is being protected from spambots. You need JavaScript enabled to view it. to support open access publication.
1. Introduction
Measurements of molecular cloud proper motions are critical for understanding how these stellar nurseries move, interact, and evolve. Molecular clouds are the main reservoirs of cold gas that fuel star formation, and their motion through the Galaxy offers key insights into Galactic structure and star formation processes. A cloud’s orbit and drift can reveal whether it follows Galactic rotation or displays peculiar motions driven by local disturbances. Investigating these motions helps to distinguish between different formation scenarios, such as triggered star formation, cloud–cloud collisions, or tidal shearing (e.g. Elmegreen 1998).
Obtaining such measurements is very challenging. Typical molecular clouds in the solar neighbourhood span about 10 pc and are seen (in the optical) as dark silhouettes against the background stellar field. Their patchy, diffuse, and extended structures lack the compactness required by traditional astrometric solution methods (such as SExtractor combined with SCAMP, Bertin & Arnouts 1996; Bertin 2006). The proper motion of a molecular cloud is expected to be small (of the order of ∼10 mas yr−1 for nearby clouds), demanding high-precision data over long time baselines.
A direct measurement of the proper motion of a molecular cloud has long been considered virtually impossible. As a result, astronomers have relied on indirect methods, most commonly assuming that the average proper motion of young stellar objects (YSOs), especially embedded ones, reflects that of the parent cloud (at least in a first order approximation; see Ducourant et al. 2017). Following the advent of Gaia astrometry (Gaia Collaboration 2016, 2018, 2021; Gaia Collaboration 2023), large samples of young stars in star-forming regions now have precise proper motions, allowing researchers to derive bulk motions of the host clouds. For example, Großschedl et al. (2021) investigated the 3D dynamics of the Orion cloud complex using Gaia DR2 proper motions and ancillary radial velocities, revealing coherent radial gas motions at a 100 pc scale. This kinematic analysis suggests that the entire Orion cloud complex is responding to a significant feedback event that took place ≈6 Myr ago (see Foley et al. 2023, and references therein). Such analyses confirm that, to a good approximation, the mean space motion of very young stars can serve as a proxy for the motion of the molecular cloud that produced them.
Another valuable tracer of molecular cloud motion comes from maser astrometry in star-forming regions. Very Long Baseline Interferometry (VLBI) observations of water and methanol maser spots embedded in molecular clouds can yield extremely precise parallaxes and proper motions (Sanna et al. 2010a,b). Over the past decade radio surveys have collected proper motion and parallax data for ∼200 masers associated with high-mass star-forming regions across the Galaxy (Reid et al. 2019), thus playing a key role in mapping Galactic structure.
However, both proxy methods come with caveats. Not all young stars move in step with their parent clouds; internal velocity dispersion, stellar interactions, and the dynamical evolution of clusters can cause stars to drift relative to the gas. Massive stars can also perturb the surrounding interstellar medium (ISM) through radiation, winds, and supernovae, altering local gas kinematics (e.g. Lopez et al. 2014; Walch & Naab 2015; Posch et al. 2025). Similarly, masers trace only small localised regions within molecular clouds (typically dense star-forming cores or shocked outflows), and their measured proper motions may include internal motions (e.g. outflows, infall) superimposed on the bulk cloud motion.
In this Letter, we present a direct measurement of the proper motion of the Corona Australis (CrA) molecular cloud, a nearby star-forming region at a distance of ∼150 pc. Our approach relies on image registration methods widely used in medical imaging to determine the transformation aligning one image with another. By comparing images taken several years apart, we detect angular offsets for nebulosities associated with the CrA cloud relative to the background sky. These offsets are interpreted as cloud proper motion.
2. Image data
We took advantage of the capabilities provided by the VISIONS ESO Public Survey (VISTA Star Formation Atlas; ESO program ID 198.C-2009; Meingast et al. 2016, 2023a), particularly its unique astrometric stability (Meingast et al. 2023b). VISIONS is a near-infrared imaging survey that covers most of the major star-forming complexes within 500 pc of the Sun. It provides wide-field coverage (hundreds of square degrees) at subarcsecond resolution, with imaging depth sufficient to capture both faint stars and extended nebulosities. Crucially, VISIONS was designed as a multi-epoch survey: each region was observed several times over the five year survey duration. When combined with earlier data from the VISTA Hemisphere Survey (VHS, McMahon et al. 2013), it can achieve a time baseline of nearly a decade. Most importantly for our study, VISIONS provides absolute astrometry for all images with typical uncertainties below 10 mas in the astrometric calibration. While the survey’s primary goal is to trace the motions of young stars, it also captures the positions of associated nebular structures.
We made use of the following publicly available multi-epoch H-band images from the VISIONS survey to demonstrate the proper motion of the dust in CrA: CrA_wide_1_4_3_A (2017-04-05) and CrA_deep_wx (2021-10-04). These are focused on the star-forming head of the cloud complex surrounding R CrA (NGC 6729). To compare object positions, we used the header WCS information to reproject the second image onto the projection of the first using reproject.reproject_exact (Robitaille 2018). The pixel scale in the images was set to be 1/3″ per pixel (Meingast et al. 2023b).
Various ISM components can be readily recognised in CrA in near-IR extinction and starlight reflection, with the latter appearing more distinct in this region. While diffuse low-intensity structures can be seen in the images of CrA, our primary aim is to investigate well-defined, mostly narrow and bright ISM components, many of which can be identified within 1 arcminute from R CrA. In this study, we focus on the following six objects (see Figs. 1 and A.1 and Appendix A): an S-shaped filamentary structure (northern lobe CrA ISM VISIONS 1 and southern lobe CrA ISM VISIONS 2) located to the east of R CrA, a lower intensity filamentary structure to the south-east of R CrA (CrA ISM VISIONS 3), the YSO CHLT 15 (or WMB 55; see Choi et al. 2008), the Herbig-Haro object HH 99B (e.g. Giannini et al. 2008), and a previously unidentified Herbig-Haro object (CrA ISM VISIONS HH). These objects were selected based on their reliable detectability in the images.
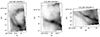 |
Fig. 1. Negative images of the investigated CrA ISM regions. Based on the reference epoch H-band image from VISIONS (CrA_wide_1_4_3_A). These images are reprojected and displayed in world coordinates; the image registration was applied in pixel coordinates. No background removal procedure was used prior to registration. |
3. Measuring cloud proper motions
Compared to point source objects, the determination of the proper motion of extended ISM structures is a complex task. Assuming that an interstellar structure moves coherently across the sky, the primary objective of any method designed to tackle this challenge is the identification of structures and their morphological changes over time. In our case, the changes primarily entail the translational motion of ISM structures. For this purpose, we utilised the SimpleITK Python package (Lowekamp et al. 2013; Yaniv et al. 2018; Beare et al. 2018), which was developed for and is extensively used in medical imaging. SimpleITK is based on the Insight Toolkit (Ibanez et al. 2005), an open-source library of image processing tools. The image registration methods (see Maintz & Viergever 1998) are the primary tools of interest for our science case; these procedures were designed to identify the transformations required to map an image onto a reference image. One of the main advantages of using image registration is the involvement of a metric that is used to assess the degree of similarity or alignment between images. This helps with structure identification between two images with differing brightness information, including systematic changes in the measured flux for extended objects due to variable background filters.
Our procedure for determining proper motions of ISM structures was designed as follows. Only subarcminute scale cutouts of the images (less than 100 px × 100 px) were selected for the analysis in order to reduce the influence of the internal motion. Based on our experiments with the SimpleITK setup (see Appendix B), we found that the accuracy of image registration is heavily affected by variable backgrounds (resulting mostly from differences in background modelling in the image processing pipeline) or unassociated ISM structures, stars, and bad pixels. To resolve this problem, background modelling and object masking are required to provide reliable measurements. Unfortunately, the background structure in the CrA cloud is quite complex, and accurately accounting for the mentioned issues in the error estimation is beyond the scope of this Letter. The investigated Herbig-Haro objects and CHLT 15 represent exceptions to this problem as they are compact and discernible from the surrounding ISM features, making it possible to model and subtract the background. We made use of the scipy.ndimage.median_filter (with a filter size of 10 px) to represent the background model for both epochs.
In SimpleITK, we set up the registration method to make use of the Correlation metric for similarity measures (see Appendix B). Linear interpolation was used to estimate pixel intensity and the regular step gradient descent was selected as the optimiser. The transformation that we are interested in is pure translation, although more complex transformations can be included in the SimpleITK setup.
To obtain the proper motion estimate of the targets, the pixel offset vector was determined with the registration method and converted to world coordinates using the WCS information included in the image headers. The projection-corrected proper motion in the right ascension, μα*, was obtained by multiplying the calculated value by cos δ. Additional projection effects might affect the pixel information across the image, but these effects are negligible at these precision levels (≳1 mas yr−1) and spatial scales (less than 40″ × 30″, δ ≈ −37°).
SimpleITK image registration procedures do not offer any error estimates for the determined pixel offsets. To provide at least some uncertainty estimates, we assumed that the errors in flux can be described by a normal distribution. The regions surrounding the investigated Herbig-Haro objects were analysed to provide a background noise estimate. On the other hand, noise estimation within the CrA cloud is impossible without proper modelling of the ISM structure, and forces us to make use of the typical noise value across the image (≈7 ADU). We added the background noise and sampled the image fluxes over nsamp = 300 iterations, determining the proper motion for each sample.
The result of our procedure corresponded to the distributions of proper motion components. The derived proper motions and their uncertainties for the investigated structures can be found in Table 1, together with the mean motions of the clusters and the YSOs in CrA (see Appendix C). A visualisation of the extracted proper motion can be seen in Fig. 2; the displayed image skeletons were obtained using skimage.morphology.skeletonize. Animated images of the investigated regions (Sect. 2) across four different epochs can be found at our online repository1.
Investigated objects and extracted proper motions, including clusters and YSOs with published astrometric data.
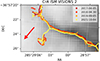 |
Fig. 2. Visualisation of the gas proper motion for CrA ISM VISIONS 2. We computed the density peaks along the ISM structure (skeletons) across four epochs between 2017 and 2021 (including CrA_wide_1_4_3_C and CrA_wide_1_4_3_F), and overlaid them on the image from the first epoch. The red arrow shows the direction of motion derived using the methods described in Sect. 3. |
The influence of the parallax on the measured proper motions was ignored in this study. Its impact is inversely proportional to the time baseline. Based on the distance of the cloud and the time baseline, we estimate that neglecting parallax should have a minimal impact on our measurements (≲1.5 mas yr−1).
4. Discussion
Although the discrepancies in motion among individual ISM structures (Table 1) are not fully explained by the estimated uncertainties, we note a very good agreement between the stellar motion and the mean of our measurements (see Appendix B for further details). This supports the validity of our assumed connection between the measured mean offsets in ISM positions and the CrA cloud’s proper motion, opening up new options for studying cloud kinematics. Recent advances in astrometric surveys (Gaia and VISIONS) together with image registration methods show great promise in this endeavour, enabling the first direct measurements of interstellar cloud proper motions.
While the determined values of the CrA proper motion seem comparable to those obtained for stars, we found that the gas appears systematically faster, which might be explained by the cluster-chains scenario explored by Posch et al. (2023, 2025). Alternatively, the provided uncertainties for the ISM regions CrA ISM VISIONS 1, CrA ISM VISIONS 2, and CrA ISM VISIONS 3 are most likely underestimated, contributing to the mentioned systematic difference. As discussed in Sect. 3 and Appendix B, the accuracy of image registration is heavily affected by the background structure of an astrophysical image. Since our error estimates are based purely on noise sampling, we ignore systematic effects, such as those resulting from the presence of the background. Future investigations of ISM proper motions will need to consider background structure modelling to improve the reliability of the results obtained with image registration methods. Additionally, while we showcase image registration as an option for determining the proper motion of a point source (CHLT 15), it is generally outperformed by procedures that track the position of sources’ point-spread functions.
Since the observed cloud motion is based on the light reflected from ISM, and R CrA shows a proper motion similar to that of the cloud, we should consider the case of a moving star illuminating a stationary cloud. An apparent motion of the cloud would be measured in such a configuration, with its magnitude depending on the relative distance between the ISM and the star. If the star is close to the ISM structure (the relative distance d is comparable to the size of the structure s), the apparent motion of the ISM almost coincides with the motion of the star, although the illuminated shape of the ISM changes significantly over time. Alternatively, if the star is farther away (d ≫ s), the illumination of the ISM is more isotropic, but the apparent motion of the ISM becomes smaller, scaling roughly as μapp ∝ d−1.
The images from VISIONS do not support the moving-star illumination scenario described in the previous paragraph; systematic changes in the shape of the illuminated ISM are negligible. The shift in the position of the ISM structure appears systematic and independent of the position relative to the star. Furthermore, all investigated ISM structures surrounding R CrA display proper motions higher than that of the star. We conclude that the available observational data provide solid evidence of a true motion of the ISM. However, we do not rule out a possible minor systematic influence of the motion of the illuminating star on the measured motion of the ISM.
We highlight the potential of applying image-registration-based morphological tracking to other nearby clouds. In addition to CrA, VISIONS has collected multi-epoch infrared images for other nearby molecular complexes (Ophiuchus, Lupus, Chamaeleon-Musca, Orion), many of which contain bright rim nebulae or filamentary structures that could serve as reference features. With the exception of Orion, the star clusters in these regions have significantly high proper motions (|μ|> 20 mas yr−1, Ratzenböck et al. 2023a) that should also be observed in the ISM, similar to the case of CrA. This makes the ISM associated with Sco-Cen the prime target for studying the full 3D kinematics of interstellar clouds.
Space missions capable of providing a higher astrometric precision than that of VISIONS would be ideal for making more precise measurements of proper motions and investigating structures at higher distances (such as Orion). The James Webb Space Telescope (JWST, Gardner et al. 2006) presently offers the best imaging capabilities for studying the proper motions of ISM structure with a resolution of 31 or 63 mas per pixel (depending on the channel, Nardiello et al. 2022), a factor of 5–10 times higher than in the case of VISIONS. Importantly, the images from JWST open the possibility to study motions of ISM not just in reflection, but also in emission. We also note that an image of the ρ Oph region was taken by JWST/NIRCam in March–April 2023. A second image taken in 2027 or 2028 should show a displacement of the cloud-associated ISM structures by ∼100 mas or ∼2 px, while only subpixel displacements can be investigated with VISIONS. Furthermore, Euclid and the Nancy Grace Roman Space Telescope both aim at a high spatial resolution, approximately two to three times that of VISIONS (Euclid Collaboration: Mellier et al. 2025; Spergel et al. 2015).
Ultimately, the ability to track morphologies of whole clouds over time will help constrain models of cloud formation and destruction, test feedback and turbulence theories, and refine our understanding of the link between gas kinematics and star-formation efficiency in our Galaxy. The presented work on CrA is a first step in this direction, demonstrating that the long-elusive proper motion of molecular clouds (and other ISM structures, such as Herbig-Haro objects) can be captured by tracking morphological features across different epochs.
See ITK Documentation for itk::CorrelationImageToImageMetricv4.
Acknowledgments
Co-funded by the European Union (ERC, ISM-FLOW, 101055318). Views and opinions expressed are, however, those of the author(s) only and do not necessarily reflect those of the European Union or the European Research Council. Neither the European Union nor the granting authority can be held responsible for them. Based on observations collected at the European Southern Observatory under ESO programme(s) 198.C-2009.
References
- Beare, R., Lowekamp, B., & Yaniv, Z. 2018, J. Stat. Softw., 86, 1 [CrossRef] [Google Scholar]
- Bertin, E. 2006, Astronomical Data Analysis Software and Systems XV, 351, 112 [NASA ADS] [Google Scholar]
- Bertin, E., & Arnouts, S. 1996, A&AS, 117, 393 [NASA ADS] [CrossRef] [EDP Sciences] [Google Scholar]
- Choi, M., Hamaguchi, K., Lee, J.-E., & Tatematsu, K. 2008, ApJ, 687, 406 [NASA ADS] [CrossRef] [Google Scholar]
- Ducourant, C., Teixeira, R., Krone-Martins, A., et al. 2017, A&A, 597, A90 [NASA ADS] [CrossRef] [EDP Sciences] [Google Scholar]
- Elmegreen, B. G. 1998, in Origins, eds. C. E. Woodward, J. M. Shull, & H. A. Thronson, Jr., Astronomical Society of the Pacific Conference Series, 148, 150 [NASA ADS] [Google Scholar]
- Euclid Collaboration (Mellier, Y., et al.) 2025, A&A, 697, A1 [Google Scholar]
- Foley, M. M., Goodman, A., Zucker, C., et al. 2023, ApJ, 947, 66 [NASA ADS] [CrossRef] [Google Scholar]
- Forbrich, J., Preibisch, T., & Menten, K. M. 2006, A&A, 446, 155 [NASA ADS] [CrossRef] [EDP Sciences] [Google Scholar]
- Gaia Collaboration(Brown, A. G. A., et al.) 2016, A&A, 595, A2 [NASA ADS] [CrossRef] [EDP Sciences] [Google Scholar]
- Gaia Collaboration (Brown, A. G. A., et al.) 2018, A&A, 616, A1 [NASA ADS] [CrossRef] [EDP Sciences] [Google Scholar]
- Gaia Collaboration (Brown, A. G. A., et al.) 2021, A&A, 649, A1 [NASA ADS] [CrossRef] [EDP Sciences] [Google Scholar]
- Gaia Collaboration (Vallenari, A., et al.) 2023, A&A, 674, A1 [NASA ADS] [CrossRef] [EDP Sciences] [Google Scholar]
- Galli, P. A. B., Bouy, H., Olivares, J., et al. 2020, A&A, 634, A98 [NASA ADS] [CrossRef] [EDP Sciences] [Google Scholar]
- Gardner, J. P., Mather, J. C., Clampin, M., et al. 2006, Space Sci. Rev., 123, 485 [Google Scholar]
- Giannini, T., Calzoletti, L., Nisini, B., et al. 2008, A&A, 481, 123 [NASA ADS] [CrossRef] [EDP Sciences] [Google Scholar]
- Großschedl, J. E., Alves, J., Meingast, S., & Herbst-Kiss, G. 2021, A&A, 647, A91 [NASA ADS] [CrossRef] [EDP Sciences] [Google Scholar]
- Hubble Legacy Archive 2012, Hubble Legacy Archive (HLA), https://hla.stsci.edu/, data retrieved from the Hubble Legacy Archive, a collaboration between the Space Telescope Science Institute (STScI/NASA), the Space Telescope European Coordinating Facility (ST-ECF/ESA), and the Canadian Astronomy Data Centre (CADC/NRC/CSA) [Google Scholar]
- Ibanez, L., Schroeder, W., Ng, L., & Cates, J. 2005, The ITK Software Guide, 2nd edn. (Clifton Park, NY: Kitware, Inc.) [Google Scholar]
- Koenig, X. P., & Leisawitz, D. T. 2014, ApJ, 791, 131 [Google Scholar]
- Lopez, L. A., Krumholz, M. R., Bolatto, A. D., et al. 2014, ApJ, 795, 121 [NASA ADS] [CrossRef] [Google Scholar]
- López, R., Estalella, R., Beltrán, M. T., et al. 2022, A&A, 661, A106 [NASA ADS] [CrossRef] [EDP Sciences] [Google Scholar]
- Lowekamp, B. C., Chen, D. T., Ibanez, L., & Blezek, D. 2013, Front. Neuroinf., 7, 45 [Google Scholar]
- Maintz, J. B. A., & Viergever, M. A. 1998, Med. Image Anal., 2, 1 [Google Scholar]
- Mainzer, A., Bauer, J., Grav, T., et al. 2011, ApJ, 731, 53 [Google Scholar]
- McMahon, R. G., Banerji, M., Gonzalez, E., et al. 2013, Messenger, 154, 35 [Google Scholar]
- Meingast, S., Alves, J., Mardones, D., et al. 2016, A&A, 587, A153 [NASA ADS] [CrossRef] [EDP Sciences] [Google Scholar]
- Meingast, S., Alves, J., Bouy, H., et al. 2023a, A&A, 673, A58 [NASA ADS] [CrossRef] [EDP Sciences] [Google Scholar]
- Meingast, S., Bouy, H., Fürnkranz, V., et al. 2023b, A&A, 673, A59 [NASA ADS] [CrossRef] [EDP Sciences] [Google Scholar]
- Nardiello, D., Bedin, L. R., Burgasser, A., et al. 2022, MNRAS, 517, 484 [NASA ADS] [CrossRef] [Google Scholar]
- Peterson, D. E., Caratti o Garatti, A., Bourke, T. L., et al. 2011, ApJS, 194, 43 [NASA ADS] [CrossRef] [Google Scholar]
- Posch, L., Miret-Roig, N., Alves, J., et al. 2023, A&A, 679, L10 [NASA ADS] [CrossRef] [EDP Sciences] [Google Scholar]
- Posch, L., Alves, J., Miret-Roig, N., et al. 2025, A&A, 693, A175 [NASA ADS] [CrossRef] [EDP Sciences] [Google Scholar]
- Ratzenböck, S., Großschedl, J. E., Möller, T., et al. 2023a, A&A, 677, A59 [NASA ADS] [CrossRef] [EDP Sciences] [Google Scholar]
- Reid, M. J., Menten, K. M., Brunthaler, A., et al. 2019, ApJ, 885, 131 [Google Scholar]
- Reipurth, B., & Bally, J. 2001, ARA&A, 39, 403 [Google Scholar]
- Reiter, M., Kiminki, M. M., Smith, N., & Bally, J. 2017, MNRAS, 470, 4671 [NASA ADS] [CrossRef] [Google Scholar]
- Robitaille, T. 2018, https://doi.org/10.5281/zenodo.1162674 [Google Scholar]
- Sanna, A., Moscadelli, L., Cesaroni, R., et al. 2010a, A&A, 517, A71 [NASA ADS] [CrossRef] [EDP Sciences] [Google Scholar]
- Sanna, A., Moscadelli, L., Cesaroni, R., et al. 2010b, A&A, 517, A78 [NASA ADS] [CrossRef] [EDP Sciences] [Google Scholar]
- Spergel, D., Gehrels, N., Baltay, C., et al. 2015, arXiv e-prints [arXiv:1503.03757] [Google Scholar]
- Walch, S., & Naab, T. 2015, MNRAS, 451, 2757 [NASA ADS] [CrossRef] [Google Scholar]
- Wright, E. L., Eisenhardt, P. R. M., Mainzer, A. K., et al. 2010, AJ, 140, 1868 [Google Scholar]
- Yaniv, Z., Lowekamp, B. C., Johnson, H. J., & Beare, R. 2018, J. Digital Imaging, 31, 290 [Google Scholar]
Appendix A: Selected objects in CrA
Images of all CrA subregions investigated in this work are presented in Fig. 1 and Fig. A.1. The investigated S-shaped ISM structure is located ≈25″ east of R CrA. The centre of the shape is much brighter than its lobes and coincides with the position of FPM 13 (or CHLT 12), an extended emission source that was previously detected in radio observations (Forbrich et al. 2006; Choi et al. 2008). The lobes of the structure extend to the north (CrA ISM VISIONS 1) of this source and to its south (CrA ISM VISIONS 2). We note that the structure is most likely visible in the VISIONS images due to the dust reflection of starlight. The remaining ISM region, CrA ISM VISIONS 3, corresponds to low-intensity stripes located ≈60″ south-east of R CrA.
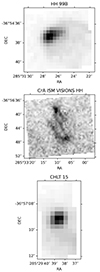 |
Fig. A.1. Negative images of the investigated Herbig-Haro objects and the YSO CHLT 15. Based on the reference epoch H-band image from VISIONS (CrA_wide_1_4_3_A). These images are reprojected and displayed in world coordinates; the image registration was applied in pixel coordinates. A simple background removal procedure was used prior to registration. |
All three investigated ISM structures can be unambiguously identified in all three VISIONS bands. The YSO FPM 13 appears brighter at longer wavelengths (based on J-band, H-band, and KS-band) when compared with the rest of the S-shaped structure. This is most likely caused by the relative absence of emission in the studied ISM structures. Furthermore, all ISM structures also appear in reflection when examining HST images (F606W and F600LP, Hubble Legacy Archive 2012).
Proper motion studies of Herbig-Haro objects have been conducted since the 1980s (see Reipurth & Bally 2001, and references therein). To our knowledge, the kinematics of such objects have not yet been investigated in CrA. Based on the results of image registration, we find that the directions of motion of HH 99B and the newly identified CrA ISM VISIONS HH appear to be identical (|μα*|≫|μδ|), with velocity amplitudes that are relatively similar (within uncertainties). This might suggest that the two objects have the same origin. The large difference in their positions in declination would put their origin far to the west of R CrA.
While the YSO CHLT 15 has already been mentioned in the literature (e.g. Choi et al. 2008), its proper motion has never been investigated. CHLT 15, also known as WMB 55 or SMM 2, is a Class I object (as determined byPeterson et al. 2011). Based on Table 1, we find that the motion of this star matches the mean motion of the other YSOs in CrA. While image registration is not directly optimised for measuring proper motions of point sources, we can at least highlight the relatively high precision of our measurement for such a target, confirming that image registration serves as a very useful tool for measuring the motion of other (interstellar) objects in astronomical images.
Appendix B: SimpleITK performance test
To test the feasibility of SimpleITK for astrophysical cases, we prepared a simple procedure that generates synthetic structures in images (resembling ISM clouds). The structure itself consists of six 2D Gaussians with highly eccentric elliptical profiles, simulating the narrow shape of a filament. Secondly, a background image is generated that consists of ten randomised 2D Gaussians, representing the complexity of the background information and a possible occurrence of diffraction spikes and other artefacts. Finally, we add noise to the image (S/Nof ∼ 50).
We create two images, the reference image and a shifted image. The shifted image is generated by moving the simulated structure over a period of time at an extremely high velocity (μx = +100 mas yr−1, μy = +20 mas yr−1, 1 px = 333 mas, ΔT = 40 yr), resulting in significant offsets (a few pixels) that should be easily detectable. The noise and the background are computed and added separately for each epoch, simulating complex changes in the image background. Afterwards, we make use of image registration as described in Sect. 3, with a prior knowledge of the true motion.
The quality of the results depends heavily on the background information. The derived proper motion tends to be extremely imprecise if the background is not modelled (see Sect. 3). An example of such a failed registration can be seen in Fig. B.1; the offset-corrected image does not match the reference image. Similar results are achieved if the same background structure is used in both images. We ran our synthetic generation code nsim = 100 times with and without our background modelling procedure (nsamp = 100), and compared the results with the true proper motion values (Fig. B.2). We find that including even the simplest background modelling algorithm significantly improves the precision of the offsets extracted using image registration when a complex background is present in the image. Additionally, we see that the registration procedure generally results in a correlation between the extracted proper motion components. Although this effect depends on the morphology of the ISM structure and the direction of motion, it appears to be always present when using image registration (at least with our setup; see Sect. 3).
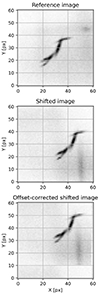 |
Fig. B.1. Extreme example of a failed registration for a case without background subtraction. This situation can occur even if the background model is identical in both images. |
We note that the presence of a bright spot (e.g. a star) in the background significantly affects the results of our measurements. Image registration might focus more on the motion of these bright spots (depending on the used similarity measure) and ignore the target of interest. If such a situation occurs, it would be important to mask the stars or to model and remove them from the images. In our investigation, we only encountered FPM 13 in the region of CrA ISM VISIONS 1. This source appears as an extended object and overlaps with the ISM features, making it difficult to remove. However, its intensity is not much higher than that of the surrounding ISM (peak flux ratio ≈1.5). We estimated its motion to be (μα*, μδ)∼(0, −50) mas yr−1 by centring on the YSO and using a box of 24 × 19 px. Curiously, not including the section of the image with FPM 13 resulted in a proper motion of (μα*, μδ)∼(0, −45) mas yr−1 for CrA ISM VISIONS 1, suggesting that the influence of FPM 13 on the measurement in Table 1 is minimal.
The above-mentioned experiments with synthetic and observed data indicate that our current image registration-based procedure lacks the ability to account for several key factors that influence proper motion measurements and their uncertainties. In particular, the choice of image region (i.e. the box around the target, for a possible solution see Reiter et al. 2017) can have a significant impact on the results, as demonstrated in the case of CrA ISM VISIONS 1. Using larger images in the SimpleITK may yield more robust results, but they are also more likely to contain various kinematically distinct ISM components, potentially introducing biases that are difficult to quantify.
It should be kept in mind that the corresponding offsets in VISIONS images are subpixel. A visual inspection alone cannot determine which of the derived proper motion values for CrA ISM VISIONS 1 is more reliable. Nevertheless, the direction of motion and the amplitude of the proper motion vectors in Table 1 are broadly consistent with the values obtained for the young stars. Further development of our procedure is necessary to enable reliable measurements of proper motions for individual ISM substructures.
Finally, the choice of the similarity metric in the SimpleITK setup is crucial for image registration. Both the Demons and the MeanSquares metrics rely on brightness consistency, a condition that is generally not satisfied when working with astronomical images. In contrast, the metrics based on mutual information or correlations are well suited for interstellar proper motions. Following the positive results reported by López et al. (2022), we decided to utilise the Correlation2 metric available in SimpleITK. We note that the more sophisticated ANTSNeighborhoodCorrelation, which accounts for localised intensity patterns, should be considered in future investigations. In our case, the differences in the derived offsets between the two correlation-based metrics are negligible.
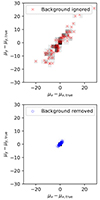 |
Fig. B.2. Comparison of extracted proper motions with true values from simulations of extreme offsets (see Appendix B). The simulation illustrates the difference between including and disregarding a background removal procedure with the presented method. |
Appendix C: Star clusters and YSOs in CrA
We compared the computed gas motion with that of the young stellar clusters associated with the CrA molecular cloud, based on the cluster census by Ratzenböck et al. (2023a). Two clusters were identified in this region: CrA-Main (96 stars), projected directly onto the cloud, and CrA-North (351 stars), located closer towards the Galactic plane. Table 1 summarises the mean positions and proper motions of both clusters, with standard deviations given as errors. For these averages, we included all cluster members, as over 97% (CrA-Main) and 98% (CrA-North) have proper motion uncertainties below 0.5 mas yr−1, with mean uncertainties of 0.1 mas yr−1.
Following the method of Galli et al. (2020), who also identified these clusters, we selected Class II YSOs within CrA-Main. Using the AllWISE (Wright et al. 2010; Mainzer et al. 2011) based classification scheme from Koenig & Leisawitz (2014) (W1 − W2 vs W2 − W3 colours), we identified 16 Class II YSOs, likely the youngest stars formed from the CrA molecular cloud. Their average kinematic properties are also listed in Table 1.
There appears to be an increase in proper motion from the CrA-North cluster to the Class II objects in CrA-Main, which continues with the motion of the cloud structure, particularly in CrA ISM VISIONS 1.
All Tables
Investigated objects and extracted proper motions, including clusters and YSOs with published astrometric data.
All Figures
|
Fig. 1. Negative images of the investigated CrA ISM regions. Based on the reference epoch H-band image from VISIONS (CrA_wide_1_4_3_A). These images are reprojected and displayed in world coordinates; the image registration was applied in pixel coordinates. No background removal procedure was used prior to registration. |
| In the text | |
|
Fig. 2. Visualisation of the gas proper motion for CrA ISM VISIONS 2. We computed the density peaks along the ISM structure (skeletons) across four epochs between 2017 and 2021 (including CrA_wide_1_4_3_C and CrA_wide_1_4_3_F), and overlaid them on the image from the first epoch. The red arrow shows the direction of motion derived using the methods described in Sect. 3. |
| In the text | |
|
Fig. A.1. Negative images of the investigated Herbig-Haro objects and the YSO CHLT 15. Based on the reference epoch H-band image from VISIONS (CrA_wide_1_4_3_A). These images are reprojected and displayed in world coordinates; the image registration was applied in pixel coordinates. A simple background removal procedure was used prior to registration. |
| In the text | |
|
Fig. B.1. Extreme example of a failed registration for a case without background subtraction. This situation can occur even if the background model is identical in both images. |
| In the text | |
|
Fig. B.2. Comparison of extracted proper motions with true values from simulations of extreme offsets (see Appendix B). The simulation illustrates the difference between including and disregarding a background removal procedure with the presented method. |
| In the text | |
Current usage metrics show cumulative count of Article Views (full-text article views including HTML views, PDF and ePub downloads, according to the available data) and Abstracts Views on Vision4Press platform.
Data correspond to usage on the plateform after 2015. The current usage metrics is available 48-96 hours after online publication and is updated daily on week days.
Initial download of the metrics may take a while.