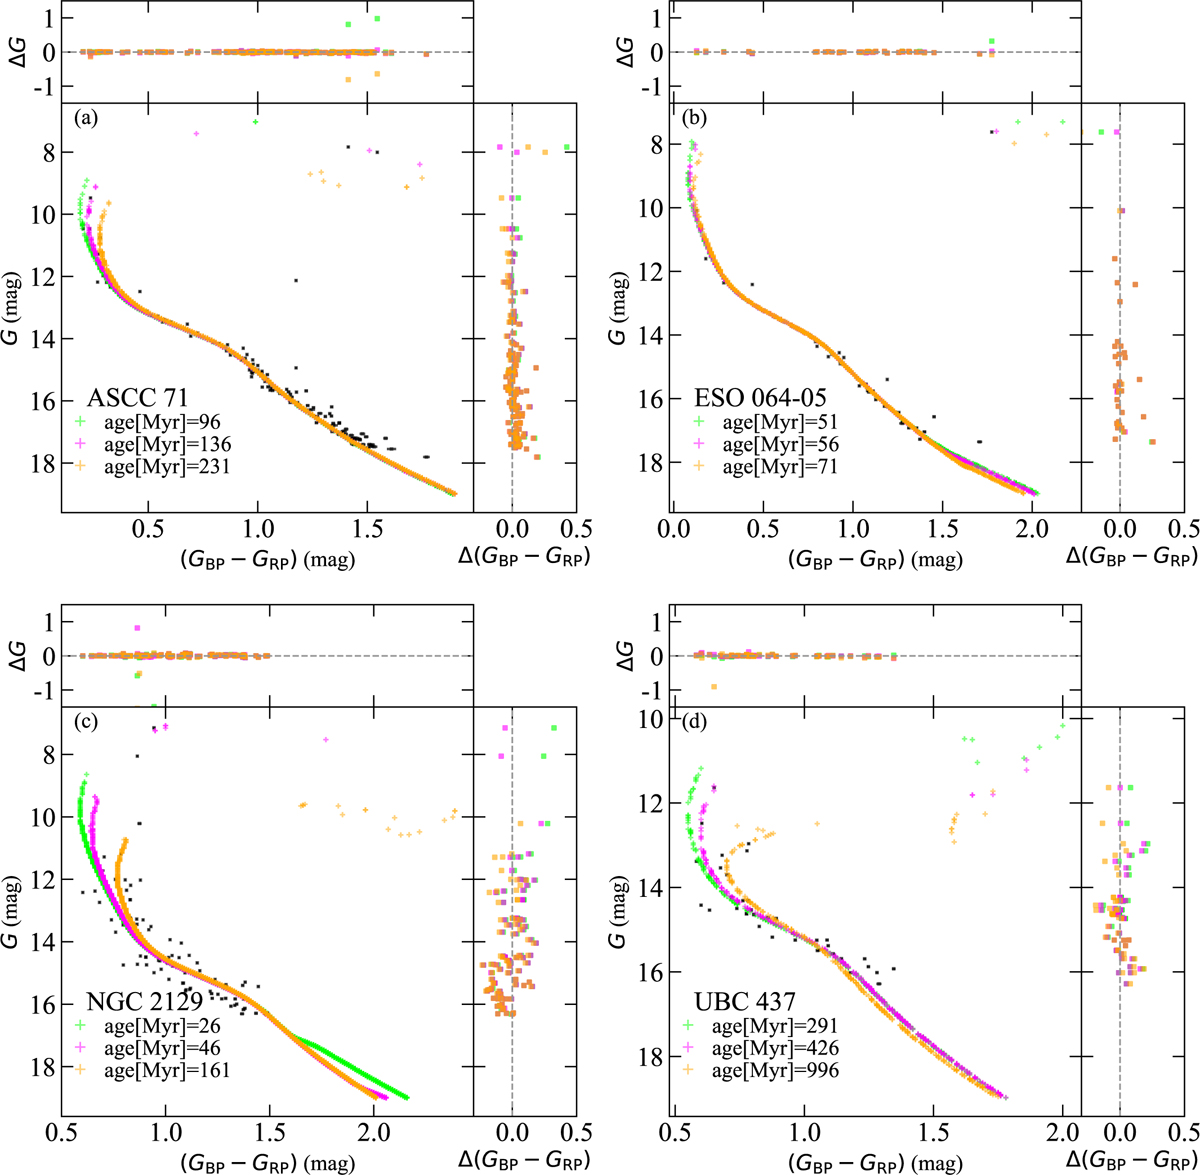
Fig. 3
Download original image
CMDs of ASCC 71, ESO 064-05, NGC 2129, and UBC 437. The black dots represent the member stars of the cluster from Gaia DR3. The magenta points represent the best-fit ages obtained from the PARSEC isochrones, and the green and orange points represent the upper and lower limits of age. The right and top panels of each subplot display the differences in magnitude and colour between the observational data and the isochrones, with the best-fitting isochrone exhibiting the smallest deviation.
Current usage metrics show cumulative count of Article Views (full-text article views including HTML views, PDF and ePub downloads, according to the available data) and Abstracts Views on Vision4Press platform.
Data correspond to usage on the plateform after 2015. The current usage metrics is available 48-96 hours after online publication and is updated daily on week days.
Initial download of the metrics may take a while.