Open Access
Fig. 4
Download original image
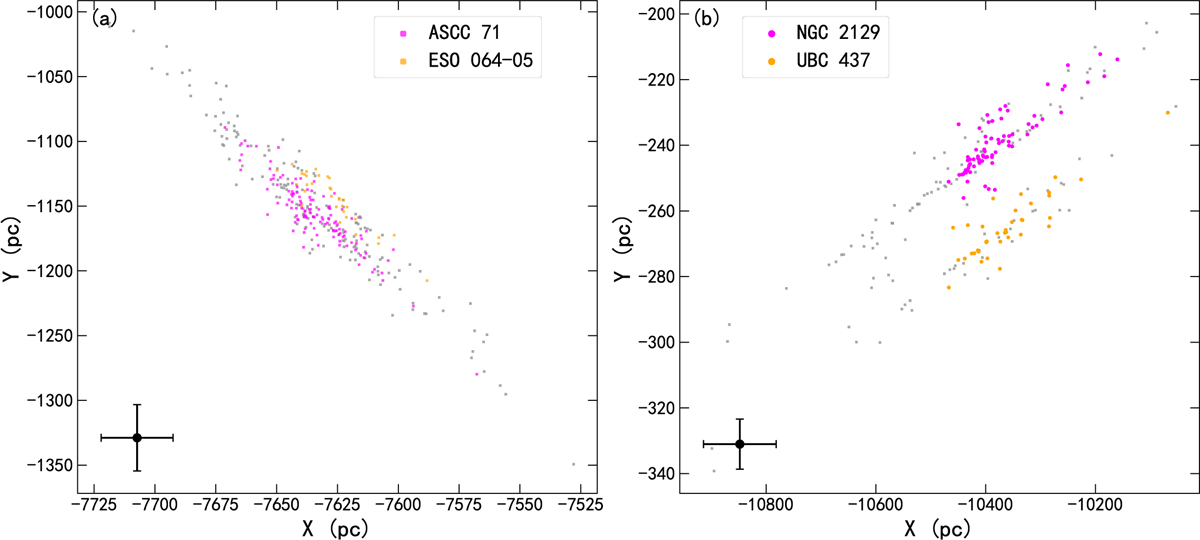
Spatial distribution of the four clusters in the Galactocentric Cartesian coordinate system on the X–Y plane. The magenta and cyan dots represent stars after distance correction via the Bayesian approach, and the grey dots represent stars generated using the parallax inverse as the distance.
Current usage metrics show cumulative count of Article Views (full-text article views including HTML views, PDF and ePub downloads, according to the available data) and Abstracts Views on Vision4Press platform.
Data correspond to usage on the plateform after 2015. The current usage metrics is available 48-96 hours after online publication and is updated daily on week days.
Initial download of the metrics may take a while.