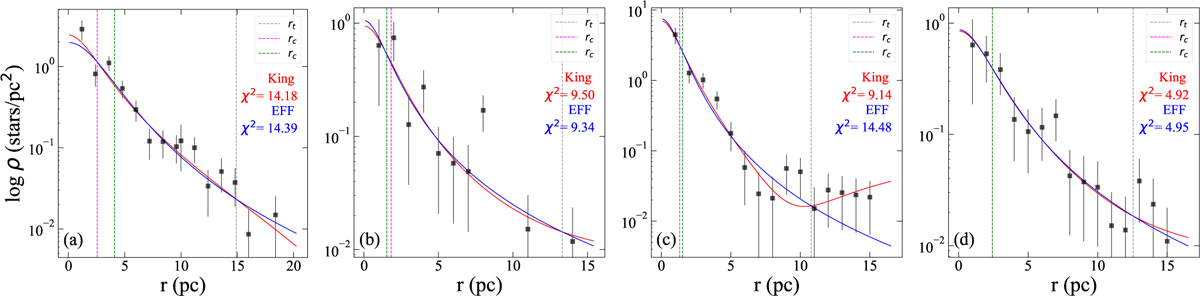
Fig. 5
Download original image
Radial density profile in 2 D spatial space for each cluster. The red and blue curves represent King and EFF templates, respectively. The dashed magenta and green lines represent the core radii derived from fitting the radial density distribution of the clusters with the King and EFF templates. The dashed grey line indicates the intersection of the King and EFF templates, representing the tidal radius of the cluster in this work.
Current usage metrics show cumulative count of Article Views (full-text article views including HTML views, PDF and ePub downloads, according to the available data) and Abstracts Views on Vision4Press platform.
Data correspond to usage on the plateform after 2015. The current usage metrics is available 48-96 hours after online publication and is updated daily on week days.
Initial download of the metrics may take a while.