Open Access
Fig. 6
Download original image
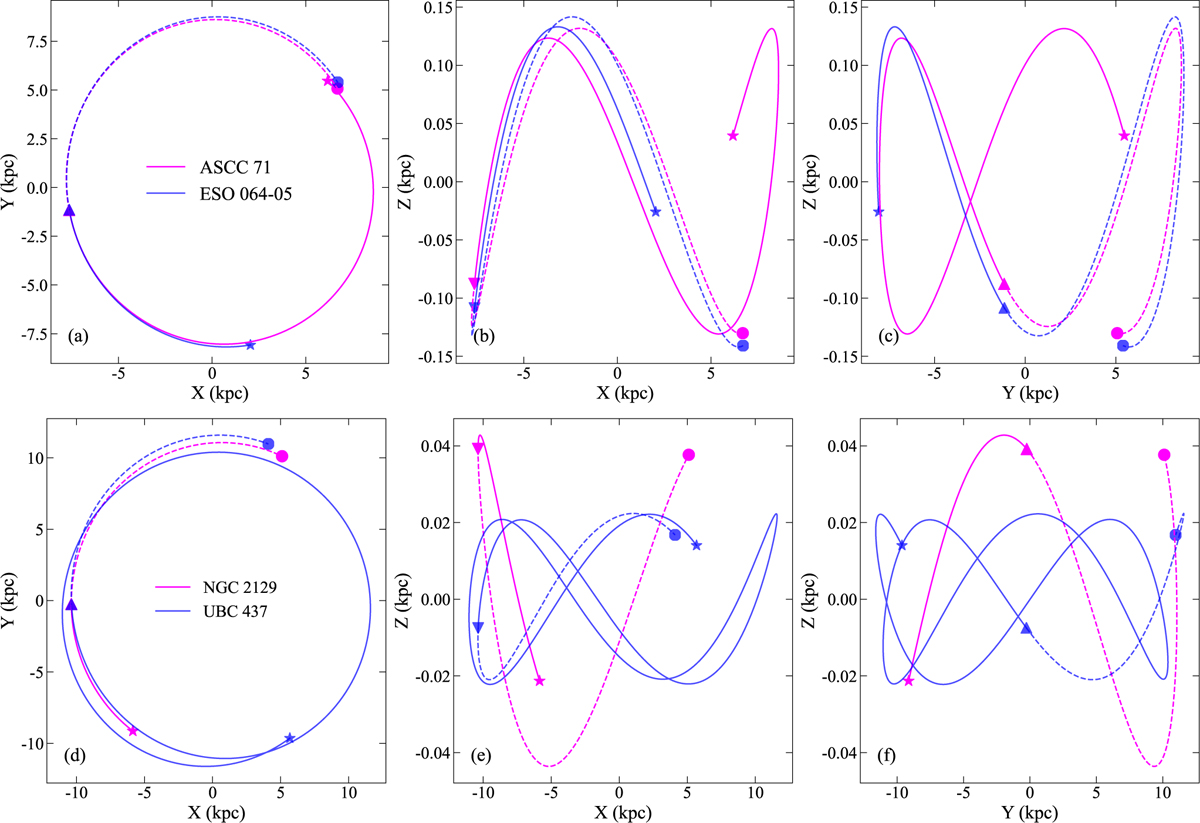
Two pairs of cluster past and future 100 Myr orbital integration using Galpy. Pentagrams (stars) represent the position of each cluster at birth, and triangles represent the present position. Circles represent positions 100 Myr later, and dotted lines depict the trajectory from the present to the future.
Current usage metrics show cumulative count of Article Views (full-text article views including HTML views, PDF and ePub downloads, according to the available data) and Abstracts Views on Vision4Press platform.
Data correspond to usage on the plateform after 2015. The current usage metrics is available 48-96 hours after online publication and is updated daily on week days.
Initial download of the metrics may take a while.