Fig. 7
Download original image
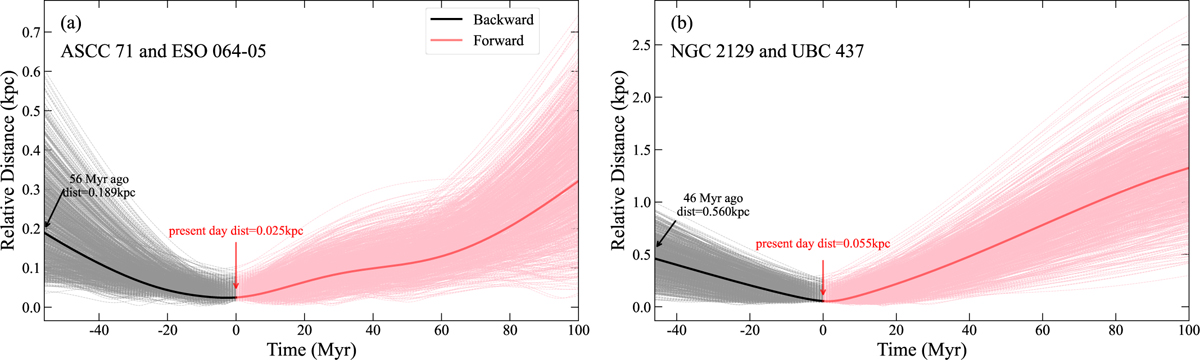
Orbital separation between the two cluster pairs as a function of time. The bold curves represent the orbital separations between cluster pairs, calculated using the average nature parameters of the clusters listed in Table 2. The light-shaded curves represent orbital separations calculated by sampling the uncertainties in the cluster’s property parameters.
Current usage metrics show cumulative count of Article Views (full-text article views including HTML views, PDF and ePub downloads, according to the available data) and Abstracts Views on Vision4Press platform.
Data correspond to usage on the plateform after 2015. The current usage metrics is available 48-96 hours after online publication and is updated daily on week days.
Initial download of the metrics may take a while.