Fig. 8
Download original image
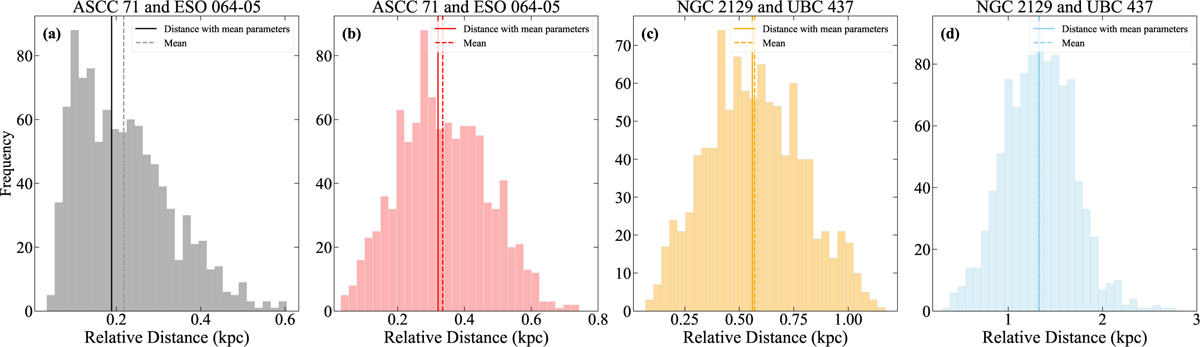
(a and b) Histograms of ASCC 71 and ESO 064-05 orbital separations at 56 Myr ago and at 100 Myr in the future. (c and d) Histograms of NGC 2129 and UBC 437 orbital separations at 46 Myr ago and at 100 Myr in the future. The solid line represents the orbital separation calculated using the cluster mean property parameter. The dashed line represents the mean value of the orbital separation obtained using the MC sampling over the measured uncertainties in cluster property parameter.
Current usage metrics show cumulative count of Article Views (full-text article views including HTML views, PDF and ePub downloads, according to the available data) and Abstracts Views on Vision4Press platform.
Data correspond to usage on the plateform after 2015. The current usage metrics is available 48-96 hours after online publication and is updated daily on week days.
Initial download of the metrics may take a while.