Open Access
Fig. A.1
Download original image
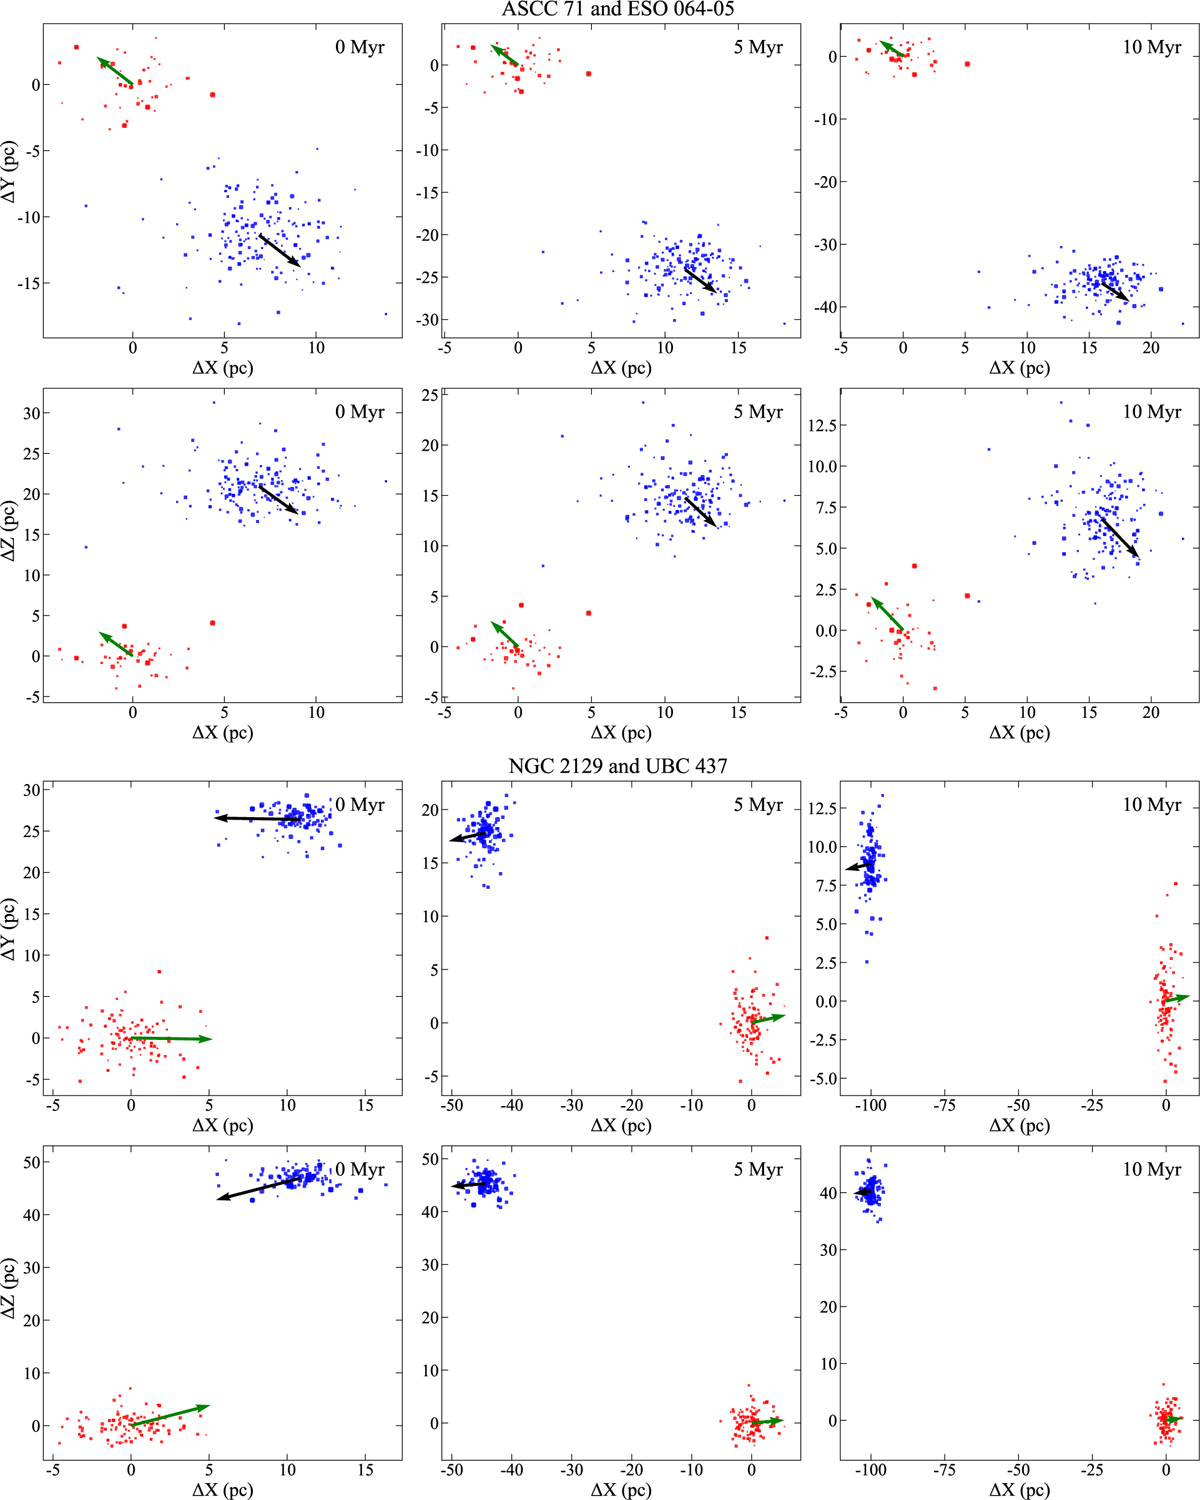
Future evolution of two pairs of clusters. We show the projections of the two pairs in the X–Y and Y–Z planes at different evolutionary times (0 Myr, 5 Myr, and 10 Myr). The size of the points represents the stellar mass. The green and red arrows indicate relative velocities..
Current usage metrics show cumulative count of Article Views (full-text article views including HTML views, PDF and ePub downloads, according to the available data) and Abstracts Views on Vision4Press platform.
Data correspond to usage on the plateform after 2015. The current usage metrics is available 48-96 hours after online publication and is updated daily on week days.
Initial download of the metrics may take a while.