Open Access
Fig. 1.
Download original image
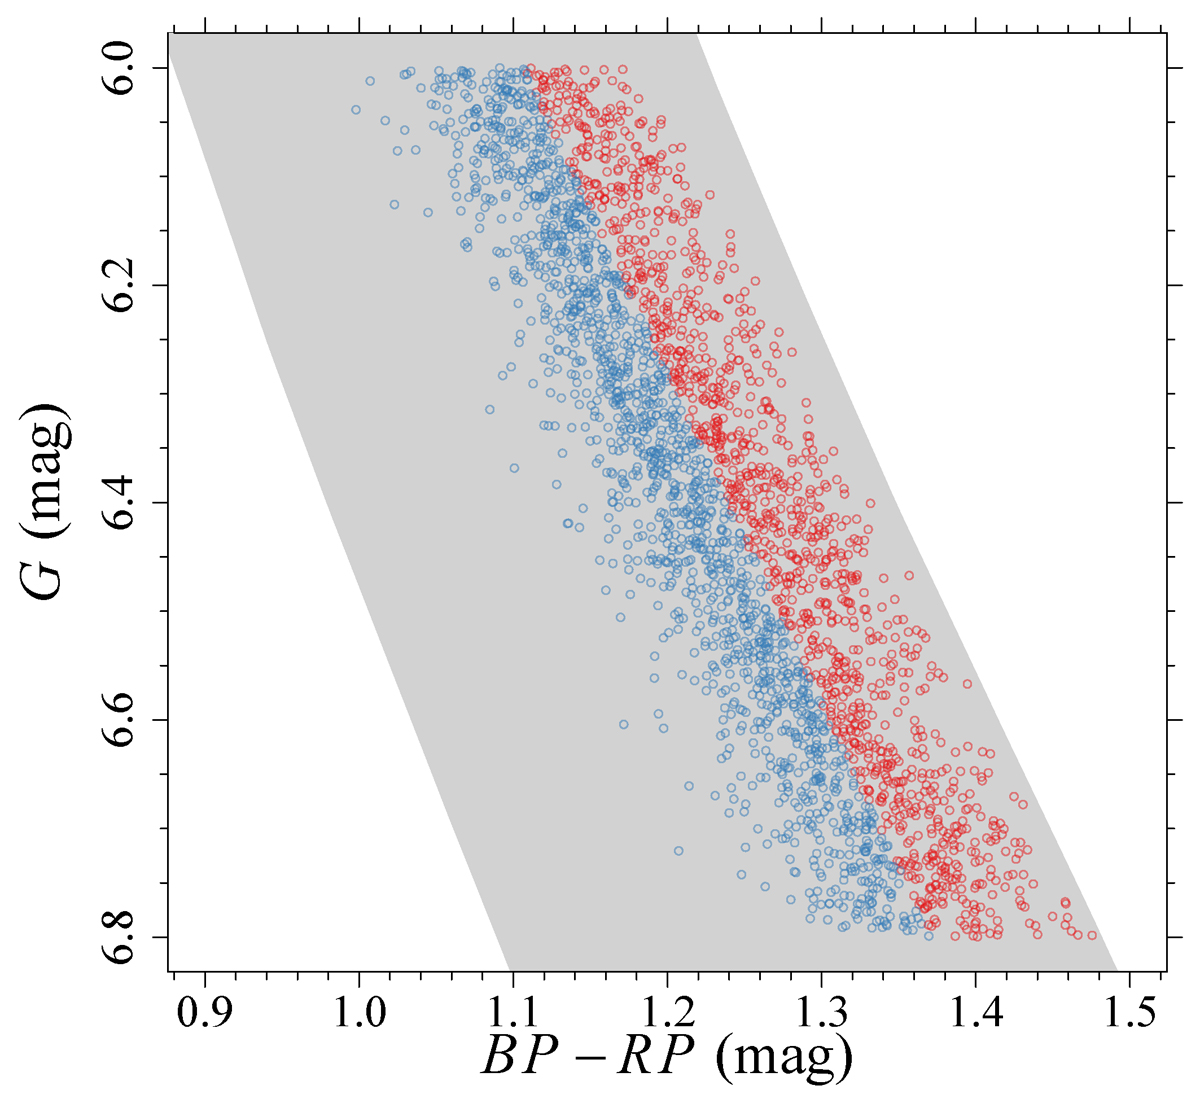
Colour-magnitude diagram in the MG vs. MBP − MRP plane of the selected stars. Different colours indicate the red and the blue part of the sample (see text). The shaded grey region indicates the area encompassed by the computed stellar isochrones.
Current usage metrics show cumulative count of Article Views (full-text article views including HTML views, PDF and ePub downloads, according to the available data) and Abstracts Views on Vision4Press platform.
Data correspond to usage on the plateform after 2015. The current usage metrics is available 48-96 hours after online publication and is updated daily on week days.
Initial download of the metrics may take a while.