Fig. 2
Download original image
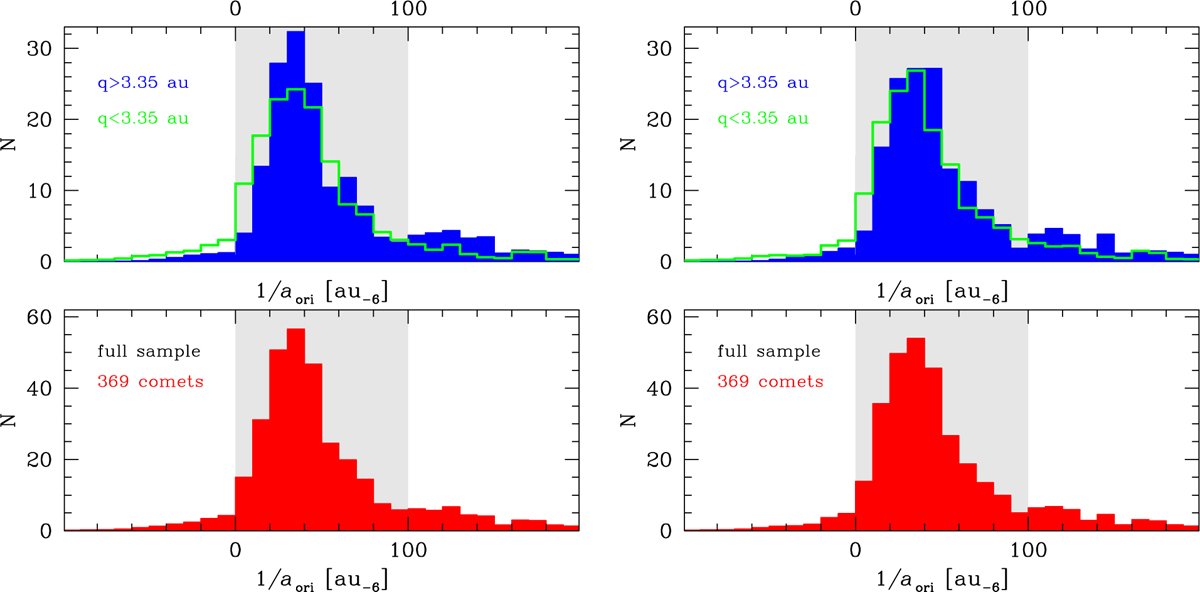
Distributions 1/aori for two samples of LPCs: small perihelion comets (green line histogram in the upper panels) and large perihelion comets (full blue histogram in the upper panels) and the sum of all LPCs included in the CODE catalogue (full red histogram in the lower panels); swarms of 5001 VCs were used, with a bin width of 10 au−6. Left panels show statistics using the ‘preferred’ orbits, while the right panels show statistics based on PB solutions (i.e. orbits preferred for backward orbital evolution).
Current usage metrics show cumulative count of Article Views (full-text article views including HTML views, PDF and ePub downloads, according to the available data) and Abstracts Views on Vision4Press platform.
Data correspond to usage on the plateform after 2015. The current usage metrics is available 48-96 hours after online publication and is updated daily on week days.
Initial download of the metrics may take a while.