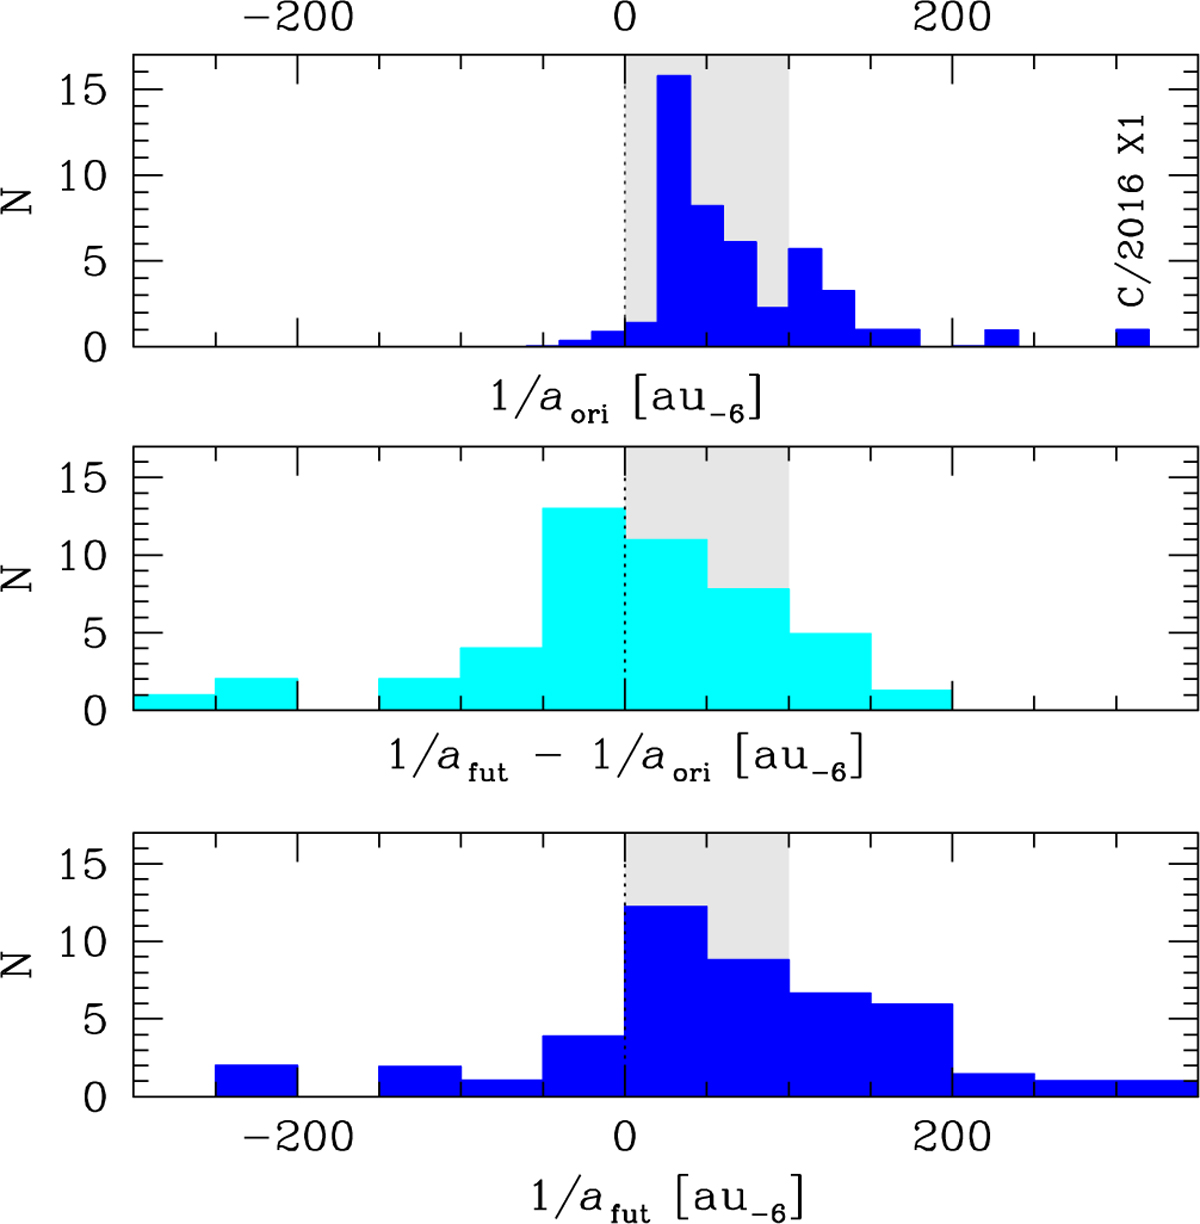
Fig. 5
Download original image
Sample of 48 LPCs from the CODE with q > 7 au. The upper and lowest panels show original and future distribution of 1/a, respectively, while the middle panel gives the distribution of planetary perturbations during the passage through the planetary system. The light grey vertical band indicates the region occupied by Oort spike comets. The range of the horizontal axes is chosen to include the tails of the aori distribution.
Current usage metrics show cumulative count of Article Views (full-text article views including HTML views, PDF and ePub downloads, according to the available data) and Abstracts Views on Vision4Press platform.
Data correspond to usage on the plateform after 2015. The current usage metrics is available 48-96 hours after online publication and is updated daily on week days.
Initial download of the metrics may take a while.