Open Access
Fig. D.1.
Download original image
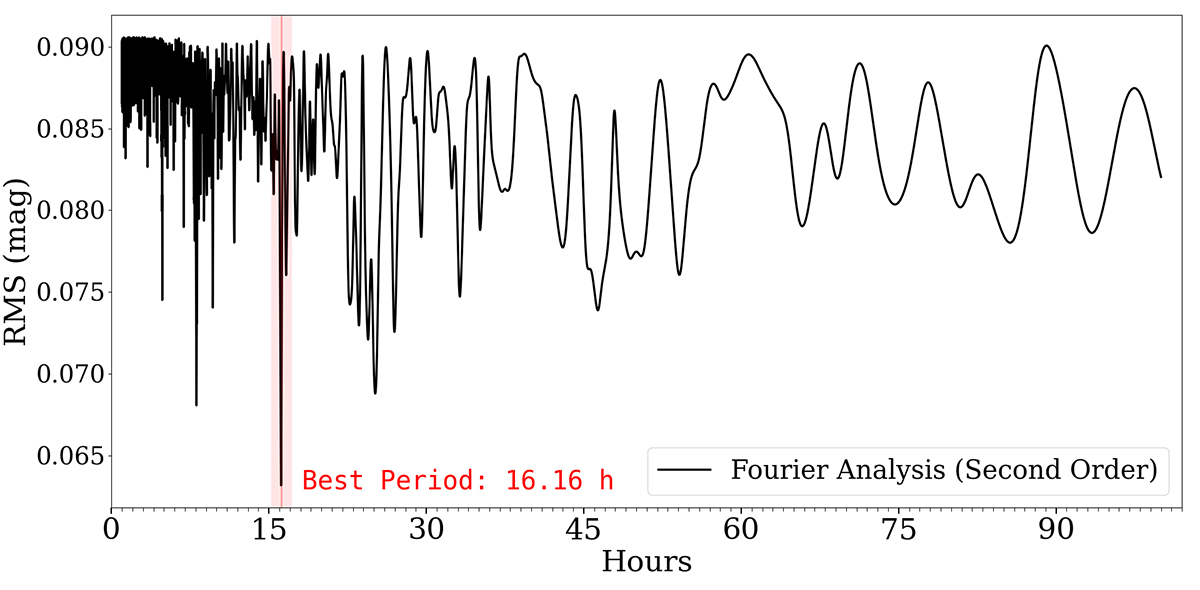
Periodogram obtained through a second-order Fourier analysis of the light curve data. The black curve represents the root mean square residuals as a function of the tested rotation period, measured in hours. A clear minimum is observed at 16.16 ± 0.01 hours, indicated by the red shaded region.
Current usage metrics show cumulative count of Article Views (full-text article views including HTML views, PDF and ePub downloads, according to the available data) and Abstracts Views on Vision4Press platform.
Data correspond to usage on the plateform after 2015. The current usage metrics is available 48-96 hours after online publication and is updated daily on week days.
Initial download of the metrics may take a while.