| Issue |
A&A
Volume 702, October 2025
|
|
|---|---|---|
| Article Number | L3 | |
| Number of page(s) | 8 | |
| Section | Letters to the Editor | |
| DOI | https://doi.org/10.1051/0004-6361/202556717 | |
| Published online | 26 September 2025 | |
Letter to the Editor
Temporal evolution of the third interstellar comet 3I/ATLAS: Spin, color, spectra, and dust activity⋆
1
Departamento de Física, Ingeniería de Sistemas y Teoría de la Señal, Universidad de Alicante, Carr. San Vicente del Raspeig, s/n, 03690 San Vicente del Raspeig, Alicante, Spain
2
Institut de Ciències del Cosmos (ICCUB), Universitat de Barcelona (UB), c. Martí Franquès, 1, 08028 Barcelona, Catalonia, Spain
3
Astronomical Institute of the Slovak Academy of Sciences, 059 60 Tatranská Lomnica, Slovak Republic
4
Astronomical Observatory Institute, Faculty of Physics and Astronomy, Adam Mickiewicz University, Słoneczna 36, 60-286 Poznań, Poland
5
South African Astronomical Observatory, 1 Observatory Rd, Observatory, Cape Town 7925, South Africa
6
Department of Physics, Stellenbosch University, Stellenbosch 7602, South Africa
7
Department of Physics, PO Box 64 FI-00014 University of Helsinki, Helsinki, Finland
⋆⋆ Corresponding author: This email address is being protected from spambots. You need JavaScript enabled to view it.
Received:
1
August
2025
Accepted:
25
August
2025
Abstract
Aims. We aim to characterize the physical and activity properties of the interstellar comet 3I/ATLAS through spectroscopic and photometric observations during the first month after its discovery.
Methods. We performed time series photometry and long-slit spectroscopy between 2 and 29 July 2025 using multiple ground-based telescopes. Photometric data were calibrated against field stars from the ATLAS and APASS catalogs, and Fourier analysis was applied to derive the comet’s rotational period. Spectral data were obtained using the Southern African Large Telescope and the Nordic Optical Telescope.
Results. We report a spin period of 16.16 ± 0.01 h with a light curve amplitude of approximately 0.3 mag. The comet exhibits increasing dust activity and reddening colors during the observation period with no visible tail detected, likely due to viewing geometry and low dust production. Dust mass-loss rates are estimated between 0.3 and 4.2 kg s−1, consistent with weakly active distant comets. Spectral colors are similar to those of outer Solar System comets and differ from previously reported values for 3I/ATLAS.
Conclusions. The morphological and photometric properties of 3I/ATLAS are consistent with a weakly active comet of outer Solar System origin despite its interstellar provenance. Continued monitoring around perihelion is necessary to track changes in activity and color, which will provide insights into the evolution of interstellar materials under solar radiation.
Key words: comets: general / comets: individual: 3I/ATLAS
Based on observations made with the Southern African Large Telescope.
© The Authors 2025
 Open Access article, published by EDP Sciences, under the terms of the Creative Commons Attribution License (https://creativecommons.org/licenses/by/4.0), which permits unrestricted use, distribution, and reproduction in any medium, provided the original work is properly cited.
This article is published in open access under the Subscribe to Open model. This email address is being protected from spambots. You need JavaScript enabled to view it. to support open access publication.
1. Introduction
Interstellar objects (ISOs) are minor bodies on hyperbolic Sun-unbound trajectories with an excess speed at infinity that confirms their extrasolar origin (Meech et al. 2017). Each ISO provides a physical sample of extrasolar planetesimals. Studying them is compelling, as their compositions, activity, and colors probe solid-body formation in other planetary systems, and the first two ISOs–1I/‘Oumuamua, an apparently inactive, extremely flattened body, and 2I/Borisov, a dust-rich comet – illustrate the diversity of extrasolar debris reservoirs (Micheli et al. 2018; Jewitt & Luu 2019). Their trajectories reveal how Galactic tides, stellar flybys, and giant-planet scattering shape Oort clouds (Seligman & Moro-Martín 2023), while unusual orbits offer rare tests of sublimation and space weathering. Rapid-response ISO campaigns also help refine strategies for anticipated Rubin Observatory discoveries (Fitzsimmons et al. 2023).
The third confirmed ISO, comet 3I/ATLAS (C/2025 N1), was discovered on 1 July 2025 by the Asteroid Terrestrial-impact Last Alert System (ATLAS) 0.5 m telescope at Río Hurtado, Chile, and announced as interstellar the next day (Minor Planet Center 2025). Archival Zwicky Transient Facility and ATLAS images extended the orbit to mid-June and confirmed the object’s extreme eccentricity, e ≈ 6 (Seligman et al. 2025). Early follow-up showed 3I/ATLAS was already active at r ≃ 4.4 au, with a dust coma detected by multiple facilities (Bolin et al. 2025; de la Fuente Marcos et al. 2025). Transiting Exoplanet Survey Satellite (Feinstein et al. 2025; Martinez-Palomera et al. 2025) and Rubin/LSST (Chandler et al. 2025) precovery data further extend the observational arc.
JPL Horizons (Giorgini 2025) predicts perihelion on 29–30 October 2025 at q ≈ 1.36 au, just inside Mars’s orbit, before it recedes into interstellar space. Ground-based observations will be impossible from September due to low solar elongation, with the object reappearing in the northern sky in late November and remaining visible until mid-2026.
Here, we present optical photometry and low-resolution spectroscopy of 3I/ATLAS. The data were obtained during its first month of observations, still beyond 3.5 au, establishing a pre-perihelion baseline for tracking its evolution.
2. Observations
2.1. Spectroscopy
Low-resolution spectroscopic observations of 3I/ATLAS (hereafter 3I) were obtained on 15 and 25 July using the 10-meter Southern African Large Telescope (SALT; see Appendix A.2.1) and the 2.56-meter Nordic Optical Telescope (NOT; see Appendix A.2.2), respectively. The SALT spectrum spanned 0.36–0.74 μm, while the NOT spectrum covered 0.4–0.90 μm. To remove the solar continuum and derive the comet’s reflectance spectrum, we observed the solar analog SA112-1333 (Landolt 1992) on the same nights. Spectra of the spectrophotometric standard Feige 110 (Oke 1990) were also obtained for flux calibration. Standard data reduction procedures were applied, after which individual comet spectra were median-combined and divided by the solar analog. The resulting reflectance spectra are shown in Fig. 1.
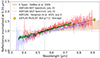 |
Fig. 1. Comparison of the spectrum of 3I/ATLAS obtained with SALT and NOT against the reference spectrum reported by Seligman et al. (2025). Overlaid on the spectral data are the campaign-averaged g′r′i′z′ photometric fluxes observed with FTN. The D-type asteroid spectrum (DeMeo et al. 2009) is plotted for reference. All the datasets are normalized to 0.55 μm. |
2.2. Photometry
Photometric observations of 3I were carried out between 2 and 29 July 2025 using the Faulkes Telescopes North and South (FTN and FTS; see Appendix A.1.1), NOT (see Appendix A.1.2), the Telescopi Joan Oró (see Appendix A.1.3), the Lesedi telescope (see Appendix A.1.4), and the Skalnaté Pleso Observatory (see Appendix A.1.5). Time series photometry was performed in the Sloan Digital Sky Survey (SDSS) r′ band, while multi-band imaging in g′r′i′z′ and V and R filters provided color measurements. Exposure times were adjusted dynamically according to seeing and plate scale, maximizing integration while keeping stellar point sources untrailed. All images were calibrated with standard procedures, including bias subtraction, dark-frame correction, and flat-fielding. Photometry was obtained via aperture photometry relative to selected field stars, with calibration based on reference magnitudes from the ATLAS All-Sky Stellar Reference Catalog (Tonry et al. 2018) or the American Association of Variable Star Observers Photometric All-Sky Survey (APASS) catalog (Henden & Munari 2014).
3. Results
3.1. Analysis of the color evolution
In the 0.4–0.7 μm range, we observed a slight reddening as the comet approached the Sun (rising g − r and g − i in Fig. 2), a neutral trend at 0.7–0.8 μm (constant r − i), and a slight bluing beyond 0.8 μm (decreasing i − z). Overall, the color is bluer than reported by Bolin et al. (2025) for 3I at similar distances but closer to Belyakov et al. (2025) and Opitom et al. (2025), who also found neutral to slightly red values. Compared to other bodies, 3I’s color resembles that of 2I/Borisov near 2 au (Epifani et al. 2021) and distant comets near 4 au (e.g., Snodgrass et al. 2008; Ivanova et al. 2015; Voitko et al. 2024), suggesting analogous dust properties.
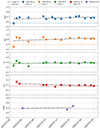 |
Fig. 2. Evolution of photometric colors over the campaign from 2 to 29 July. A reddening trend can be observed in the wavelength range covered by the g, r, and i bands, while a bluing trend can be seen in the i − z color. |
Spectroscopy shows a similar trend: Spectral gradients from NOT and SALT reflectance data indicate progressive reddening. Seligman et al. (2025) reported 17.1 ± 0.2%/μm on 4 July, while we measured 21.1 ± 0.2%/μm (SALT, 15 July) and 22.8 ± 0.1%/μm (NOT, 25 July) over 0.4–0.7 μm. Beyond 0.7 μm, the NOT spectrum flattens to 9.8 ± 0.3%/μm at 0.7–0.9 μm, consistent with Opitom et al. 2025 and de la Fuente Marcos et al. 2025. In contrast, NIR spectra (Kareta et al. 2025; Yang et al. 2025) show a strong flattening beyond 0.9 μm, with slopes ∼3%/1000 Å, implying a transition to neutral or slightly blue slopes. Thus, 3I shows wavelength-dependent evolution, as it is redder in the optical and flatter or bluer in the NIR, consistent with the i − z color trend. Future spectroscopy will track slope changes, emission lines, and activity.
3.2. Magnitude and dust production level
Between 2 and 29 July, photometric observations of 3I show a progressive brightening, consistent with its decreasing heliocentric distance from 4.5 au to ∼3.6 au. The absolute magnitude was H ∼ 12 mag, in agreement with the H ∼ 11.9 reported by Jewitt & Luu (2025). Assuming a geometric albedo pv = 0.04, the estimated upper limit on the comet radius is ∼11 km (see Table C.1). The dust activity level, expressed as Afρ, is ∼300 cm, which is consistent with Bolin et al. (2025) but higher than values observed for 2I/Borisov (Guzik et al. 2020; Opitom et al. 2019). This is comparable to measurements of Jupiter-family comets at large heliocentric distances and some distant comets exhibiting similar activity (Ivanova et al. 2015; Voitko et al. 2024). Estimated dust mass-loss rates range from ∼0.3 to 4.2 kg s−1, slightly above those reported by Bolin et al. (2025) yet lower than typical rates for Jupiter-family comets at large distances (Gillan et al. 2024) and comparable to distant comets observed even farther from the Sun (Ivanova et al. 2015). Detailed methodology, relevant equations, and complete tables are provided in Appendix C.
3.3. Light curve
Using the time series photometry described in Sect. 2.2, we generated a rotational light curve of 3I. Observations occurred while the comet crossed the Galactic plane, requiring mitigation techniques to minimize stellar contamination. Fourier analysis yielded a best-fitting spin period of 16.16 ± 0.01 h (see Fig. 3). The legend of Fig. 3 lists the Minor Planet Center (MPC) codes of the telescopes used. The light curve shows a peak-to-peak amplitude of ∼0.3 mag and prominent aliases near 8 and 24 h (see Fig. D.1). This broadly agrees with the ∼16.79 h period reported by de la Fuente Marcos et al. (2025), though their estimate – based on 2–5 July photometry – may be affected by the limited temporal baseline.
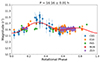 |
Fig. 3. Rotational light curve of comet 3I/ATLAS phased with a spin period of 16.16 ± 0.01 h. Photometric data points from multiple telescopes are shown with error bars; their MPC codes are listed in the box within the figure. The red solid line represents the best-fitting second-order Fourier model to the phased light curve. The MPC codes correspond to the following telescopes: C65 (Telescopi Joan Oró), E10 (FTS), F65 (FTN), M28 (Lesedi telescope), and Z23 (NTO). |
The light curve amplitude, A, can be related to the projected axis ratio of a triaxial ellipsoid via b/a = 10−0.4A (e.g., Binzel & Sauter 1989), giving b/a ≈ 0.76–0.83 for A = 0.2–0.3 mag, which represents minimum elongations for equatorial viewing and small phase angles (α = 4°–12°). Using the Hubble Space Telescope upper limit on the nucleus radius, rn ≤ 2.8 km (Jewitt et al. 2025), the maximum principal axes are
 (1)
(1)
4. Conclusions
The morphology of comet 3I over one month reveals clear activity, with continuous dust emission evidenced by the increasing coma size as the heliocentric distance decreased. The absence of a visible tail is likely caused by the observing geometry. The coma remained predominantly asymmetric, with no signs of fragmentation or rapid changes. Overall, 3I shows characteristics typical of weakly active outer Solar System comets despite its interstellar origin. Time series photometry indicates a spin period of 16.16 ± 0.01 h, with a maximum light curve amplitude of 0.3 mag at the start, decreasing to 0.2 mag – likely as increasing activity progressively masks the nucleus’s rotational signal. The light curve amplitude, A, relates to the projected axis ratio via b/a = 10−0.4A (e.g., Binzel & Sauter 1989), giving b/a ≈ 0.76–0.83 for A = 0.2–0.3 mag and representing minimum elongations for equatorial viewing and small phase angles (α = 4°–12°). Enhanced activity is further supported by a reddening trend in the comet’s colors.
Measured Afρ values (∼300 cm) are comparable to distant Jupiter-family comets (Gillan et al. 2024), but dust production rates are lower than expected for an object of this brightness at r ≃ 4 au, suggesting a coma dominated by large particles. Independent Hubble Space Telescope observations report dust mass-loss rates of ∼6–60 kg s−1 (Jewitt et al. 2025), also indicating large grains. The absence of a distinct tail and the homogeneous coma morphology support this, as massive particles are less affected by solar radiation pressure and remain near the nucleus, implying a deficit of submicron dust that would otherwise enhance light scattering. Further polarimetric and infrared observations are needed to constrain the particle size distribution. We plan to continue photometric and spectroscopic monitoring, including polarimetry to detect changes in color and light-scattering properties of the coma pre- and post-perihelion. These observations are essential to characterizing interstellar material and its evolution under solar radiation as well as enabling comparisons with small bodies in the Solar System.
Acknowledgments
T.S-R. acknowledges funding from Ministerio de Ciencia e Innovación (Spanish Government), PGC2021, PID2021-125883NB-C21. This work was (partially) supported by the Spanish MICIN/AEI/10.13039/501100011033 and by “ERDF A way of making Europe” by the “European Union” through grant PID2021-122842OB-C21, and the Institute of Cosmos Sciences University of Barcelona (ICCUB, Unidad de Excelencia ‘María de Maeztu’) through grant CEX2019-000918-M. D.O. was supported by grant No. 2022/45/B/ST9/00267 from the National Science Centre, Poland. O.I. and M.H. thank the Slovak Grants by the Agency for Science, VEGA, grant No. 2/0059/22. This work is based on observations made at the South African Astronomical Observatory (SAAO), which is financially supported by the South African National Research Foundation (NRF). Some of the observations reported in this paper were obtained with the Southern African Large Telescope (SALT). Polish participation in SALT is funded by grant No. MEiN nr 2021/WK/01. The Joan Oró Telescope (TJO) at the Montsec Observatory (OdM) is owned by the Catalan Government and operated by the Institute of Space Studies of Catalonia (IEEC). Partly based on observations made with the Nordic Optical Telescope. The NOT data were obtained under program ID 71-411 (PI A. Penttilä). Work of Skalnaté Pleso has made use of data from the Asteroid Terrestrial-impact Last Alert System (ATLAS) project. ATLAS is primarily funded to search for near-Earth asteroids through NASA grants NN12AR55G, 80NSSC18K0284, and 80NSSC18K1575; byproducts of the NEO search include images and catalogs from the survey area. The ATLAS science products have been made possible through the contributions of the University of Hawaii Institute for Astronomy, the Queen’s University Belfast, the Space Telescope Science Institute, and the South African Astronomical Observatory. This paper is based on observations made with the MuSCAT instruments, developed by the Astrobiology Center (ABC) in Japan, the University of Tokyo, and Las Cumbres Observatory (LCOGT). MuSCAT3 was developed with financial support by JSPS KAKENHI (JP18H05439) and JST PRESTO (JPMJPR1775), and is located at the Faulkes Telescope North on Maui, HI (USA), operated by LCOGT. MuSCAT4 was developed with financial support provided by the Heising-Simons Foundation (grant 2022-3611), JST grant number JPMJCR1761, and the ABC in Japan, and is located at the Faulkes Telescope South at Siding Spring Observatory (Australia), operated by LCOGT. Some observations were obtained by the Comet Chasers schools outreach program (https://www.cometchasers.org/), which is funded by the UK Science and Technology Facilities Council (via the DeepSpace2DeepImpact Project), the Open University, and Cardiff University. It accesses the LCOGT telescopes through the Schools Observatory/Faulkes Telescope Project (TSO2025A-00 DFET – The Schools’ Observatory), which is partly funded by the Dill Faulkes Educational Trust, and the LCO Global Sky Partners Programme (LCOEPO2023B-013). Schools making observations included The Coopers Company & Coborn School, Upminster, UK, Ysgol Gyfun Gymraeg Bro Edern, Cardiff, UK, St Marys Catholic Primary School, Bridgend, UK, Institut d’Alcarràs, Catalonia, Spain, Louis Cruis Astronomy Club and Srednja škola Jelkovec (Jelkovec High School), Zagreb, Croatia.
References
- A’Hearn, M. F., Schleicher, D. G., Millis, R. L., Feldman, P. D., & Thompson, D. T. 1984, AJ, 89, 579 [Google Scholar]
- Belyakov, M., Bolin, B. T., Fremling, C., & Graham, M. 2025, ATel, 17276, 1 [Google Scholar]
- Binzel, R. P., & Sauter, L. M. 1989, Asteroids II (Univ. of Arizona Press), 416 [Google Scholar]
- Bolin, B. T., Belyakov, M., Fremling, C., et al. 2025, MNRAS, 542, L139 [Google Scholar]
- Bowell, E., Hapke, B., Domingue, D., et al. 1989, in Asteroids II, eds. R. P. Binzel, T. Gehrels, & M. S. Matthews (University of Arizona Press), 524 [Google Scholar]
- Burgh, E. B., Nordsieck, K. H., Kobulnicky, H. A., et al. 2003, in Instrument Design and Performance for Optical/Infrared Ground-based Telescopes, eds. M. Iye, & A. F. M. Moorwood, SPIE Conf. Ser., 4841, 1463 [Google Scholar]
- Chandler, C. O., Bernardinelli, P. H., Jurić, M., et al. 2025, arXiv e-prints [arXiv:2507.13409] [Google Scholar]
- Colomé, J., Ribas, I., Francisco, X., et al. 2010, Adv. Astron., 2010, 183016 [Google Scholar]
- de la Fuente Marcos, R., Alarcon, M. R., Licandro, J., et al. 2025, A&A, 700, L9 [NASA ADS] [CrossRef] [EDP Sciences] [Google Scholar]
- DeMeo, F. E., Binzel, R. P., Slivan, S. M., & Bus, S. J. 2009, Icarus, 202, 160 [Google Scholar]
- Epifani, E. M., Dotto, E., Perna, D., et al. 2021, Planet. Space Sci., 208, 105341 [Google Scholar]
- Erasmus, N., Steele, I., Piascik, A. S., et al. 2024a, JATIS, 10, 025005 [Google Scholar]
- Erasmus, N., Potter, S. B., van Gend, C. H. D. R., et al. 2024b, in Ground-based and Airborne Instrumentation for Astronomy X, eds. J. J. Bryant, K. Motohara, & J. R. D. Vernet, SPIE Conf. Ser., 13096, 130968K [Google Scholar]
- Erasmus, N., Potter, S. B., van Gend, C. H. D., et al. 2025, Revista Mexicana de Astronomía y Astrofísica, Serie de Conferencias (RMxAC) (Instituto de Astronomía, Universidad Nacional Autónoma de México), 59, 201 [Google Scholar]
- Feinstein, A. D., Noonan, J. W., & Seligman, D. Z. 2025, ApJ, 991, L2 [Google Scholar]
- Fink, U., & Rubin, M. 2012, Icarus, 221, 721 [NASA ADS] [CrossRef] [Google Scholar]
- Fitzsimmons, A., Bannister, M. T., & Moro-Martín, A. 2023, ARA&A, 61, 155 [Google Scholar]
- Fukui, A., Narita, N., Kusakabe, N., et al. 2022, PASJ, 74, 1361 [Google Scholar]
- Gillan, A. F., Fitzsimmons, A., Denneau, L., et al. 2024, PSJ, 5, 25 [Google Scholar]
- Giorgini, J. D. 2025, JPL HORIZONS system: Ephemeris for 3I/ATLAS, https://ssd.jpl.nasa.gov/horizons, accessed 2025 July 4 [Google Scholar]
- Guzik, P., Drahus, M., Rusek, K., et al. 2020, Nat. Astron., 4, 53 [Google Scholar]
- Henden, A., & Munari, U. 2014, Contrib. Astron. Obs. Skalnate Pleso, 43, 518 [NASA ADS] [Google Scholar]
- Henden, A. A., Templeton, M., Terrell, D., et al. 2016, VizieR On-line Data Catalog: II/336 [Google Scholar]
- Hsieh, H. H., Chandler, C. O., Denneau, L., et al. 2021, ApJ, 922, L9 [Google Scholar]
- Ivanova, O., Neslušan, L., Krišandová, Z. S., et al. 2015, Icarus, 258, 28 [Google Scholar]
- Ivanova, O. V., Luk, I. V., Kiselev, N. N., et al. 2016, Planet. Space Sci., 121, 10 [NASA ADS] [CrossRef] [Google Scholar]
- Ivanova, O., Luk’yanyk, I., Kolokolova, L., et al. 2019, A&A, 626, A26 [NASA ADS] [CrossRef] [EDP Sciences] [Google Scholar]
- Ivanova, O., Rosenbush, V., Luk’yanyk, I., et al. 2021, A&A, 651, A29 [NASA ADS] [CrossRef] [EDP Sciences] [Google Scholar]
- Ivanova, O., Rosenbush, V., Luk’yanyk, I., et al. 2023, A&A, 672, A76 [NASA ADS] [CrossRef] [EDP Sciences] [Google Scholar]
- Jewitt, D., & Luu, J. 2019, ApJ, 886, L29 [Google Scholar]
- Jewitt, D., & Luu, J. 2025, ATel, 17263, 1 [Google Scholar]
- Jewitt, D., & Meech, K. J. 1987, ApJ, 317, 992 [NASA ADS] [CrossRef] [Google Scholar]
- Jewitt, D., Mutchler, M., Weaver, H., et al. 2016, ApJ, 829, L8 [Google Scholar]
- Jewitt, D., Hui, M.-T., Mutchler, M., Kim, Y., & Agarwal, J. 2025, ApJ, 990, L2 [Google Scholar]
- Kareta, T., Champagne, C., McClure, L., et al. 2025, ApJ, 990, L65 [Google Scholar]
- Kobulnicky, H. A., Nordsieck, K. H., Burgh, E. B., et al. 2003, in Instrument Design and Performance for Optical/Infrared Ground-based Telescopes, eds. M. Iye, & A. F. M. Moorwood, SPIE Conf. Ser., 4841, 1634 [Google Scholar]
- Kostov, A., & Bonev, T. 2018, Bulg. Astron. J., 28, 3 [Google Scholar]
- Kwiatkowski, T., Kryszczyńska, A., Polińska, M., et al. 2009, A&A, 495, 967 [NASA ADS] [CrossRef] [EDP Sciences] [Google Scholar]
- Landolt, A. U. 1992, AJ, 104, 340 [Google Scholar]
- Larson, S., & Sekanina, Z. 1984, AJ, 89, 571 [NASA ADS] [CrossRef] [Google Scholar]
- Manzini, F., Oldani, V., Ochner, P., & Bedin, L. R. 2020, MNRAS, 495, L92 [Google Scholar]
- Martinez-Palomera, J., Tuson, A., Hedges, C., et al. 2025, AAS, submitted [arXiv:2508.02499] [Google Scholar]
- Meech, K. J., & Svoren, J. 2004, in Comets II, eds. M. C. Festou, H. U. Keller, & H. A. Weaver (Tucson: Univ. of Arizona Press), 317 [Google Scholar]
- Meech, K. J., Weryk, R., Micheli, M., et al. 2017, Nature, 552, 378 [Google Scholar]
- Micheli, M., Farnocchia, D., Meech, K. J., et al. 2018, Nature, 559, 223 [Google Scholar]
- Minor Planet Center 2025, C/2025 N1 (ATLAS) = 3I/ATLAS, Minor Planet Electronic Circular 2025-N12, https://minorplanetcenter.net/mpec/K25/K25N12.html [Google Scholar]
- Narita, N., Fukui, A., Kusakabe, N., et al. 2020, JATIS, 6, 045002 [Google Scholar]
- Oke, J. 1990, AJ, 99, 1621 [NASA ADS] [CrossRef] [Google Scholar]
- Opitom, C., Fitzsimmons, A., Jehin, E., et al. 2019, A&A, 631, L8 [NASA ADS] [CrossRef] [EDP Sciences] [Google Scholar]
- Opitom, C., Snodgrass, C., Jehin, E., et al. 2025, arXiv e-prints [arXiv:2507.05226] [Google Scholar]
- Parrott, D. 2020, JAAVSO, 48, 262 [NASA ADS] [Google Scholar]
- Potter, S. B., Erasmus, N., van Gend, C. H. D. R., et al. 2024, in Observatory Operations: Strategies, Processes, and Systems X, eds. C. R. Benn, A. Chrysostomou, & L. J. Storrie-Lombardi, SPIE Conf. Ser., 13098, 130980Y [Google Scholar]
- Samarasinha, N. H., & Larson, S. M. 2014, Icarus, 239, 168 [NASA ADS] [CrossRef] [Google Scholar]
- Schleicher, D. G., & Bair, A. N. 2011, AJ, 141, 177 [Google Scholar]
- Seligman, D. Z., & Moro-Martín, A. 2023, NatA, 7, 1105 [Google Scholar]
- Seligman, D. Z., Micheli, M., Farnocchia, D., et al. 2025, ApJ, 989, L36 [Google Scholar]
- Snodgrass, C., Lowry, S. C., & Fitzsimmons, A. 2008, MNRAS, 385, 737 [Google Scholar]
- Tonry, J. L., Denneau, L., Flewelling, H., et al. 2018, ApJ, 867, 105 [NASA ADS] [CrossRef] [Google Scholar]
- Voitko, A., Zubko, E., Ivanova, O., Husárik, M., & Videen, G. 2024, Icarus, 411, 115967 [Google Scholar]
- Willmer, C. N. A. 2018, ApJS, 236, 47 [Google Scholar]
- Worters, H. L., O’Connor, J. E., Carter, D. B., et al. 2016, in Ground-based and Airborne Instrumentation for Astronomy VI, eds. C. J. Evans, L. Simard, & H. Takami, SPIE Conf. Ser., 9908, 99083Y [Google Scholar]
- Yang, B., Meech, K. J., Connelley, M., & Keane, J. V. 2025, ApJL, submitted [arXiv:2507.14916] [Google Scholar]
Appendix A: Observational facilities
A.1. Photometry
A.1.1. Faulkes Telescopes North and South
We used the 2.0 m Faulkes Telescope North (FTN; MPC code F65), located at Haleakalā Observatory in Maui, Hawai‘i (USA), and the 2.0-m Faulkes Telescope South (FTS; MPC code E10), located at Siding Spring Observatory in New South Wales (Australia), to obtain photometry in the SDSS g′, r′, i′, and z′ bands using the MuSCAT3 and MuSCAT4 instruments, respectively. MuSCAT3 is equipped with four 1k × 1k CCDs (Hamamatsu Photonics), each with a pixel scale of 0.27″ and a field of view of 7.4 × 7.4 arcmin2, while MuSCAT4 features four 2k × 2k CCDs, with a pixel scale of 0.38″ and a field of view of 13 × 13 arcmin2 (Narita et al. 2020; Fukui et al. 2022). Both instruments enable simultaneous multi-band imaging via dichroic beam splitters. The detectors exhibit low readout noise (∼3–5 e−), and the photometric data were processed using the MuSCAT pipeline, which includes standard calibrations (bias, dark, and flat-field corrections) and aperture photometry optimized for each band.
A.1.2. Nordic Optical Telescope
Photometric observations in the Sloan r′ filter were performed at the Nordic Optical Telescope (NOT) using the Alhambra Faint Object Spectrograph and Camera (ALFOSC). The NOT is a 2.56-meter telescope located at the Spanish Roque de los Muchachos Observatory (ORM), La Palma, Canarias, Spain (MPC code: 950). On 17 July 2025, three series of 80 exposures with 30-second integration times were obtained, and on 18 July 2025, one series of 80 exposures with 30-second integration times was acquired.
A.1.3. Telescopi Joan Oró
We used the 0.8 m Telescopi Joan Oró (MPC code C65), located in the Catalan Pyrenees, to obtain time series photometry in the SDSS r′ band on the nights of 4, 6, 13, 16, 17, and 19 July. On 4 and 6 July, the backup camera MEIA2 (2k × 2k Andor iKon XL, pixel scale 0.36″) was used, while on the remaining nights the main camera MEIA3 (4k × 4k Andor iKon XL 230-84, pixel scale 0.4″) was employed. Both cameras have very similar performance, differing slightly in gain (1.55 e−/ADU for MEIA2 vs. 1.04 e−/ADU for MEIA3) and readout noise (8 e− vs. 9 e−, respectively). The main distinction lies in the field of view: 0.13 deg for MEIA2 and 0.45 deg for MEIA3. All images were calibrated using the IEEC Calibration and Analysis Tool (ICAT; Colomé et al. 2010).
A.1.4. Lesedi
Multi-filter photometric observations were collected with the f/8, 1-meter Lesedi telescope (Worters et al. 2016), located at the South African Astronomical Observatory’s (SAAO) observing site in the Northern Cape, South Africa (GPS coordinates: 32°22′47.2″ S, 20°48′38.4″ E; MPC code: M28). The instrument used was Mookodi (Erasmus et al. 2024a), which in imaging mode provides a field of view of 10 arcmin × 10 arcmin and is equipped with a full SDSS filter set (u′g′r′i′z′). The telescope operates in a fully robotic mode each night as part of the SAAO’s Intelligent Observatory (IO) initiative (Potter et al. 2024; Erasmus et al. 2024b, 2025), and data were collected under the rapid-response near-Earth asteroid follow-up program currently running at the SAAO (PIs: T.S Ngwane and N. Erasmus).
Observations were obtained on 02, 07, 15 and 23 July 2025 using 1×1 binning (0.59 arcsec/pixel), the slowest readout mode of 0.5 MHz (to minimize readout noise), and the highest gain setting of 1.2 e−/ADU.
On 02/07, a time series observation was carried out by cycling through the g′, r′, i′, and z′ filters continuously between 20:06:02 and 20:45:05, with an exposure time of 120 seconds per filter. The five g′-filter and five r′-filter frames collected during this window were median-stacked and used to generate the intensity maps shown in the top row of Fig. C.1.
On 07/07, two time series datasets were obtained. The first was in the z′ filter only, spanning approximately one hour between 19:35:27 and 20:20:59, using 30-second exposures. The second followed a similar multi-filter sequence to that of 02/07, with 30-second exposures between 20:26:18 and 21:15:12. The seven g′-filter and six r′-filter frames collected during this window were median-stacked.
On 15/07, a time series cycling between only the g′ and r′ filters was performed, with 30-second exposures between 19:48:07 and 20:42:47. Approximately 20 frames per filter were collected and stacked to generate the intensity maps shown in the third row of Fig. C.1.
A near-identical observing strategy to that used on 15/07 was employed on 23/07, and the resulting analysis is shown in the fifth row of Fig. C.1.
The photometric colors, dust activity levels, and dust mass-loss rates were also extracted from the median stacks in the relevant filters for each days and are reported in Tables A.1 and C.1.
A.1.5. Skalnaté Pleso Observatory
Photometric material at the Skalnaté Pleso Observatory (MPC code 056) for the interstellar comet 3I/ATLAS was acquired using a 0.61-m f/4.3 Newtonian telescope equipped with an SBIG ST-10XME CCD camera and Johnson-Cousins R and V photometric filters. Observations were conducted using 2 × 2 binning, yielding a resolution of 1.07 arcsec per pixel. Standard reduction procedures were applied, including bias subtraction, dark frame subtraction, and flat-field correction. Tycho Tracker software (Parrott 2020) was used as the main tool for deriving magnitudes and Afρ quantities. Stellar magnitudes for standard stars were taken from the ATLAS catalog, an all-sky reference catalog containing approximately one billion stars down to a limiting magnitude of 19. The catalog integrates data from Pan-STARRS DR1, ATLAS Pathfinder, ATLAS re-flattened APASS, SkyMapper DR1, APASS DR9, Tycho-2, and the Yale Bright Star Catalog. Developed by Tonry et al. (2018), it provides a robust foundation for photometric calibration (Kostov & Bonev 2018). Interstellar comet 3I/ATLAS was observed on five nights between July 3 and July 23.
A.2. Spectroscopy
A.2.1. Southern African Large Telescope
Low-resolution spectroscopy of 3I/ATLAS was performed using the 10-meter Southern African Large Telescope (SALT; Kwiatkowski et al. 2009), located in Sutherland, South Africa (IAU code: B31). Observations were conducted on 2025 July 15 using the Robert Stobie Spectrograph (RSS; Burgh et al. 2003; Kobulnicky et al. 2003) under program 2025-1-DDT-004 (PI: T. Kwiatkowski). The RSS is equipped with a detector comprising a 3 × 1 mini-mosaic of CCD chips, each with 2048 × 4102 pixels of 15 μm size and a pixel scale of 0.12 arcseconds per unbinned pixel. We obtained 20 exposures of 120 s each using the PG0700 grating and a 3″ narrow slit, aligned along the comet’s trail. Observations were conducted in 4 × 4 binning mode.
Due to the comet’s proximity to the Milky Way, significant contamination from background stars occurred along the slit. Consequently, only 5×120 s exposures, during which the comet was positioned against a clean sky region, were retained. All spectra obtained along the slit were extracted, but only the comet spectrum was analyzed. A solar analog star, SA112-1333, was observed on the same night and at a similar airmass for calibration purposes.
Data reduction and calibration followed standard procedures, including bias subtraction, flat-field correction, sky background subtraction, and one-dimensional aperture extraction. Wavelength calibration was performed using an argon lamp spectrum. The individual spectra of 3I/ATLAS were median-combined and divided by the median-combined spectrum of the solar analog to remove the solar continuum. The final reflectance spectrum spans the wavelength range 3600–7400 Å, with gaps between 4820–4980 Å and 6160–6300 Å.
A.2.2. Nordic Optical Telescope
Long-slit spectroscopic observations were carried out at the Nordic Optical Telescope (NOT) using ALFOSC on 25 July 2025, at an airmass of approximately ∼1.5. A series of 13 × 180-second exposures were obtained using Grism #4, which covers the wavelength range from 0.32 μm to 0.96 μm, with a 1.8-arcsecond-wide slit. To minimize atmospheric dispersion, the instrument was aligned along the parallactic angle. No second-order blocking filter was used.
It should be noted that for Grism #4, second-order light from the U-band becomes noticeable above 5900 Å, contributing up to 20% of the recorded signal, and from the B-band contributes around 5%. For flux calibration and spectral normalization, the solar analog BD-004074 and the spectrophotometric standard star Feige 110 were observed using the same setup.
We followed standard data reduction procedures. Helium and neon arc lamps were used for wavelength calibration, while halogen flats were employed for pixel response correction. Bias frames were also acquired to correct for the detector’s electronic offset.
Results of the multi-band photometry of 3I/ATLAS by the FTN, FTS, Lesedi, and Skalnaté Pleso telescopes.
Appendix B: Morphology of the coma
We created intensity maps (Fig. C.1) by co-adding the photometric images taken with the SDSS g′ and r′ filters on the two dates of the observing campaign, 4 and 29 July 2025. A more detailed view of the comet’s morphological evolution from 2 to 29 July is presented in Fig. C.1. The cometary coma appears compact and slightly asymmetrical. No visible tail was detected before 16 July. A slight elongation of the coma, resembling a short tail, was observed between 18 and 26 July, directed roughly at a position angle of 280°. Observations by Kareta et al. (2025) using the NASA Infrared Telescope Facility similarly showed no prominent tail. This absence, also evident in our images and those from other observers, can be partially attributed to the tail being projected ‘behind’ the comet due to the low phase angle during the observations. This effect may be further enhanced if the comet contains relatively few fine dust grains, which are the most affected by radiation pressure. To search for faint structures within the weak coma of comet 3I, we applied digital image enhancement techniques, including the rotational gradient method (Larson & Sekanina 1984), the 1/ρ profile, and re-normalization filtering (Samarasinha & Larson 2014). These methods were applied only to the stacked images, as the object was too faint for filtering of individual frames. No jet-like or other morphological features were detected.
The absence of distinct morphological structures in comet 3I is consistent with its currently low level of activity. Long-period and dynamically new comets can display enhanced activity (Meech et al. 2004), with noticeable coma structures even at large heliocentric distances (Jewitt & Luu 2019; Ivanova et al. 2019, 2021, 2023). However, such behavior strongly depends on the intrinsic properties of the nucleus, including its volatile inventory and the spatial distribution of active areas. For comparison, comet 2I/Borisov exhibited much stronger activity, characterized by an elongated coma, jet-like outflows, and a well-developed tail (Manzini et al. 2020). The limited morphology observed in comet 3I therefore reflects both its early activation stage and its particular physical characteristics.
Appendix C: Photometry and dust parameter derivation
The comet magnitudes in various filters on 02, 07, and 15 July 2025, measured within an aperture ranging from 10,300 to 11,600 km in radius centered on the optocenter, are listed in Table A.1. Standard star magnitudes were taken from the APASS catalog (Henden et al. 2016), with an average photometric uncertainty of 0.02 mag.
Merged results of dust activity and photometry of comet 3I/ATLAS by Lesedi and Skalnaté Pleso telescopes.
Absolute magnitudes were computed as
 (C.1)
(C.1)
where rh and Δ are the heliocentric and geocentric distances (in au), α is the phase angle, and β = 0.04 mag/deg is the assumed phase coefficient.
The dust production proxy, Afρ, was calculated following A’Hearn et al. (1984)
 (C.2)
(C.2)
where m⊙ and mc are the magnitudes of the Sun and the comet, and ρ is the aperture radius. Solar magnitudes were taken from Willmer (2018). Phase corrections to 0° phase angle were applied using the function from Schleicher & Bair (2011). Results are provided in Tables A.1 and C.1.
The scattering cross-section C (km2) was derived following Jewitt et al. (2016)
 (C.3)
(C.3)
where pv = 0.04 is the geometric albedo. The corresponding radius is  , representing an upper limit to the nucleus size.
Dust ejection velocity estimates ve follow Jewitt & Meech (1987) and Hsieh et al. (2021), yielding velocities between ∼0.012 and 1.2 m s−1 for particle sizes from millimeters to meters.
The dust mass loss rate  was calculated following Fink & Rubin (2012)
 (C.4)
(C.4)
assuming a bulk dust density ρd = 1000 kg m−3 (Ivanova et al. 2016) and pv = 0.04. Results are reported in Table C.1.
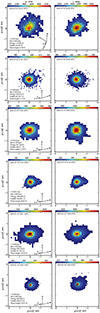 |
Fig. C.1. Intensity maps of comet 3I/ATLAS in the g and r SDSS filters. The colour scale does not reflect the absolute brightness of the comet. Arrows indicate the directions toward the Sun, celestial north, east, and the negative velocity vector of the comet projected onto the plane of the sky. |
Appendix D: Determination of the spin state and light curve amplitude
We compiled all observations obtained in the SDSS r′ band to derive the light curve of 3I/ATLAS. For some datasets, particularly those obtained during the first week of July, image stacking was employed to increase the signal-to-noise ratio of the comet. All individual frames were visually inspected to identify and exclude those affected by stellar contamination, which was common due to the comet’s motion toward the Galactic plane. To maximize the signal from the cometary nucleus while minimizing the contribution from the surrounding coma and background noise, photometric measurements were performed using an optimized circular aperture matched to the object’s point spread function (PSF). Specifically, the aperture radius was set to encompass approximately one standard deviation (1σ) of the full width at half maximum (FWHM) of the comet’s brightness profile in the stacked image. Photometric uncertainties were computed by combining photon noise, background noise, and scatter in the reference star magnitudes.
The photometric measurements were reduced by applying light-time correction to the observation epochs, as well as distance corrections for the varying heliocentric and geocentric distances. A phase correction was applied using the H–G photometric system (Bowell et al. 1989), assuming a standard slope parameter of G = 0.15. To determine the best-fitting rotation period, we performed a Fourier analysis using a second-order harmonic function (see Fig D.1).
In some light curve segments–particularly from F65 and Z23–the rotational modulation was not clearly detected, showing a relatively flat curve clustering near the average magnitude. This likely results from observing conditions (e.g., seeing, telescope resolution) and intrinsic comet activity, which enhances the coma and dilutes nucleus variability. The extensive Z23 dataset was probably acquired under such conditions, partially or entirely suppressing the rotational signature. Inclusion of these flat segments reduced the rotational contrast and introduced ambiguity in the Fourier analysis, likely contributing to alias solutions.
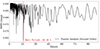 |
Fig. D.1. Periodogram obtained through a second-order Fourier analysis of the light curve data. The black curve represents the root mean square residuals as a function of the tested rotation period, measured in hours. A clear minimum is observed at 16.16 ± 0.01 hours, indicated by the red shaded region. |
All Tables
Results of the multi-band photometry of 3I/ATLAS by the FTN, FTS, Lesedi, and Skalnaté Pleso telescopes.
Merged results of dust activity and photometry of comet 3I/ATLAS by Lesedi and Skalnaté Pleso telescopes.
All Figures
|
Fig. 1. Comparison of the spectrum of 3I/ATLAS obtained with SALT and NOT against the reference spectrum reported by Seligman et al. (2025). Overlaid on the spectral data are the campaign-averaged g′r′i′z′ photometric fluxes observed with FTN. The D-type asteroid spectrum (DeMeo et al. 2009) is plotted for reference. All the datasets are normalized to 0.55 μm. |
| In the text | |
|
Fig. 2. Evolution of photometric colors over the campaign from 2 to 29 July. A reddening trend can be observed in the wavelength range covered by the g, r, and i bands, while a bluing trend can be seen in the i − z color. |
| In the text | |
|
Fig. 3. Rotational light curve of comet 3I/ATLAS phased with a spin period of 16.16 ± 0.01 h. Photometric data points from multiple telescopes are shown with error bars; their MPC codes are listed in the box within the figure. The red solid line represents the best-fitting second-order Fourier model to the phased light curve. The MPC codes correspond to the following telescopes: C65 (Telescopi Joan Oró), E10 (FTS), F65 (FTN), M28 (Lesedi telescope), and Z23 (NTO). |
| In the text | |
|
Fig. C.1. Intensity maps of comet 3I/ATLAS in the g and r SDSS filters. The colour scale does not reflect the absolute brightness of the comet. Arrows indicate the directions toward the Sun, celestial north, east, and the negative velocity vector of the comet projected onto the plane of the sky. |
| In the text | |
|
Fig. D.1. Periodogram obtained through a second-order Fourier analysis of the light curve data. The black curve represents the root mean square residuals as a function of the tested rotation period, measured in hours. A clear minimum is observed at 16.16 ± 0.01 hours, indicated by the red shaded region. |
| In the text | |
Current usage metrics show cumulative count of Article Views (full-text article views including HTML views, PDF and ePub downloads, according to the available data) and Abstracts Views on Vision4Press platform.
Data correspond to usage on the plateform after 2015. The current usage metrics is available 48-96 hours after online publication and is updated daily on week days.
Initial download of the metrics may take a while.