Fig. 3.
Download original image
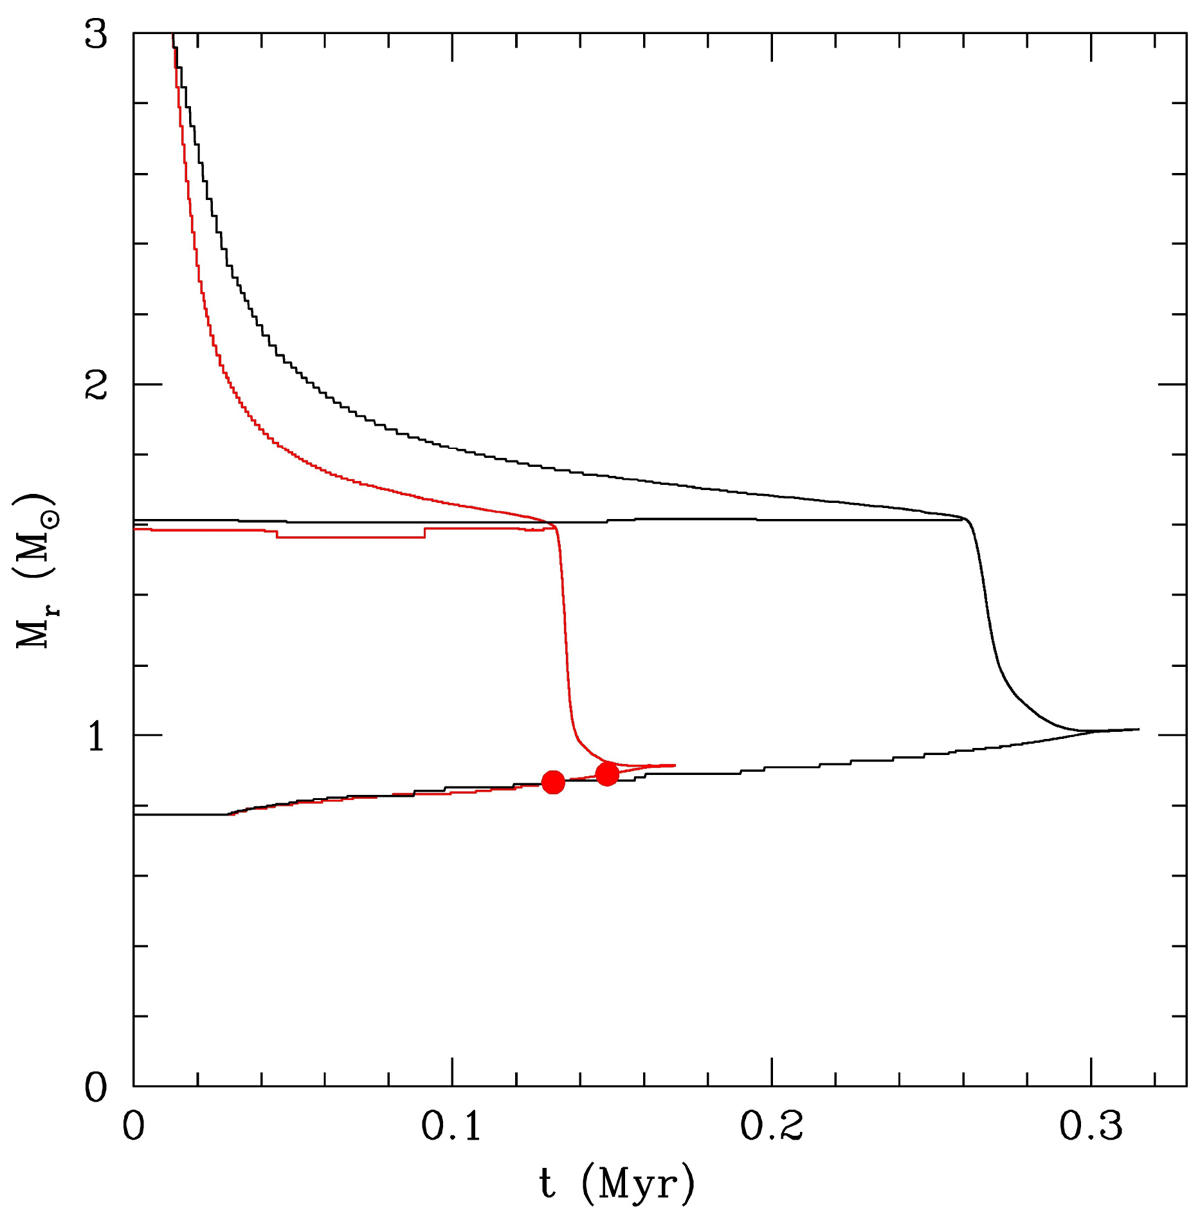
ALP impact on the SDU. Black lines (top to botton): Inner border of the convective envelope, location of the H-burning shell and location of the He-burning shell, for a 7 M⊙ (no ALPs), during the early-AGB phase; red lines (top to bottom): same as the black lines, but with g10 = 0.6 and g13 = 1.5. The filled circles represent the He-shell locations for the two models in Fig. 2.
Current usage metrics show cumulative count of Article Views (full-text article views including HTML views, PDF and ePub downloads, according to the available data) and Abstracts Views on Vision4Press platform.
Data correspond to usage on the plateform after 2015. The current usage metrics is available 48-96 hours after online publication and is updated daily on week days.
Initial download of the metrics may take a while.