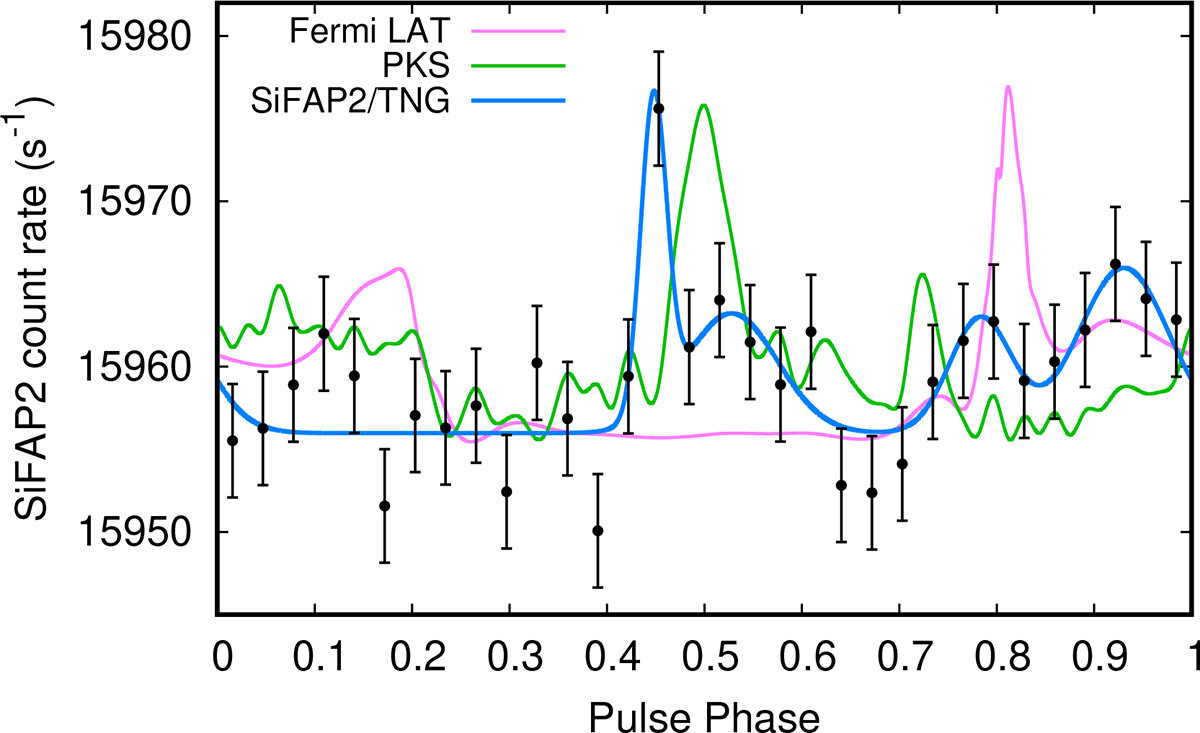
Fig. 2.

Download original image
Phase-aligned pulse profiles observed in W2 by SiFAP2 (black points), Parkes (green line), and Fermi-LAT (magenta line; taken from 3PC catalogue, S23, and shifted assuming that the lag with the radio profile is the same as reported there). The normalisation of the radio and gamma-ray profiles is arbitrary. The reference epoch was set to align with the radio peak at phase 0.5. The blue line is a fit to the SiFAP2 pulse profile with four Gaussians added to a constant level.
Current usage metrics show cumulative count of Article Views (full-text article views including HTML views, PDF and ePub downloads, according to the available data) and Abstracts Views on Vision4Press platform.
Data correspond to usage on the plateform after 2015. The current usage metrics is available 48-96 hours after online publication and is updated daily on week days.
Initial download of the metrics may take a while.


