| Issue |
A&A
Volume 702, October 2025
|
|
|---|---|---|
| Article Number | L21 | |
| Number of page(s) | 6 | |
| Section | Letters to the Editor | |
| DOI | https://doi.org/10.1051/0004-6361/202556783 | |
| Published online | 24 October 2025 | |
Letter to the Editor
Evidence of optical pulsations from a redback millisecond pulsar
1
INAF Osservatorio Astronomico di Roma, via di Frascati 33, I-00078 Monteporzio Catone, Roma, Italy
2
INAF Osservatorio Astronomico di Cagliari, Via della Scienza 5, I-09047 Selargius (CA), Italy
3
Max Planck Institute for Gravitational Physics (Albert Einstein Institute), D-30167 Hannover, Germany
4
Leibniz Universität Hannover, D-30167 Hannover, Germany
5
Dipartimento di Fisica, Sapienza Università di Roma, Piazzale Aldo Moro 5, I-00185 Rome, Italy
6
INAF Osservatorio Astronomico di Brera, Via Bianchi 46, I-23807 Merate (LC), Italy
7
ASI – Agenzia Spaziale Italiana, Via del Politecnico snc, 00133 Roma, Italy
8
Fundación Galileo Galilei – INAF, Rambla Josè Ana Fernández Pèrez, 7, E-38712 Breña Baja, TF, Spain
9
Università degli Studi di Catania, Via S. Sofia, 64, I-95123 Catania, Italy
⋆ Corresponding author: This email address is being protected from spambots. You need JavaScript enabled to view it.
Received:
8
August
2025
Accepted:
24
September
2025
Abstract
Recent detections of optical pulsations from both a transitional and an accreting millisecond pulsar have revealed unexpectedly bright signals, suggesting that the presence of an accretion disk enhances the efficiency of optical emission, possibly via synchrotron radiation from accelerated particles. In this work we present optical observations of the redback millisecond pulsar PSR J2339–0533, obtained with the SiFAP2 photometer mounted on the Telescopio Nazionale Galileo. Data accumulated during the campaign with the longest exposure time (12 h) suggest that its ∼18 mag optical counterpart pulsates at the neutron star’s spin frequency. This candidate signal was identified by folding the optical time series using the pulsar ephemeris derived from nearly simultaneous observations with the 64 m Murriyang (Parkes) radio telescope. The detection significance of the candidate optical signal identified in those data lies between 2.9 and 3.5σ, depending on the statistical test employed. The pulse duty cycle is ≲1/32, and the de-reddened pulsed magnitude in the V band is (26.0 ± 0.6) mag. At a distance of 1.7 kpc, this corresponds to a conversion efficiency of ∼3 × 10⁻⁶ of the pulsar’s spin-down power into pulsed optical luminosity – which is comparable to the values observed in young, isolated pulsars like the Crab but 50–100 times lower than in disk-accreting millisecond pulsars. If confirmed, these findings suggest that optical pulsations of MSPs arise independently of an accretion disk and support the notion that such disks boost the optical emission efficiency.
Key words: stars: neutron / pulsars: individual: PSR J2339-0533
© The Authors 2025
 Open Access article, published by EDP Sciences, under the terms of the Creative Commons Attribution License (https://creativecommons.org/licenses/by/4.0), which permits unrestricted use, distribution, and reproduction in any medium, provided the original work is properly cited.
This article is published in open access under the Subscribe to Open model. This email address is being protected from spambots. You need JavaScript enabled to view it. to support open access publication.
1. Introduction
Millisecond pulsars (MSPs) are thought to form through a prolonged (0.1–1 Gyr) accretion phase in which a neutron star gains mass and angular momentum from a low-mass companion (Alpar et al. 1982). During this low-mass X-ray binary phase, X-ray pulsations can occur as the magnetic field funnels infalling material towards poles (Wijnands & van der Klis 1998). Once accretion ceases, the system transitions into a rotation-powered state, with the neutron star emitting primarily in radio and gamma rays (Backer et al. 1982; Abdo et al. 2009). A rare class of systems – transitional MSPs – has been observed to switch between accretion- and rotation-powered states on timescales of days to weeks due to variations in the accretion rate (Archibald et al. 2009; Papitto et al. 2013). Recently, optical pulsations at the spin period of the neutron star have been detected from both a transitional and an accreting MSP using the fast optical photometer SiFAP2 on the 3.6 m Telescopio Nazionale Galileo (TNG; Ambrosino et al. 2017, 2021; see also Zampieri et al. 2019 and Karpov et al. 2019). The unexpectedly high brightness of these optical pulsations challenges models based solely on rotation- or accretion-powered mechanisms, suggesting that the interaction of the pulsar’s relativistic wind with the accretion disk plays a key role (Papitto et al. 2019; Veledina et al. 2019; Illiano et al. 2023). Rotation-powered MSPs in compact binaries share similar spin and orbital characteristics with transitional MSPs and are ideal systems to test the origin of optical pulsations. So far, only an upper limit has been reported (mg < 25 mag; Strader et al. 2016).
J2339 64 m Murriyang (Parkes) timing parameters.
In this Letter we report on SiFAP2/TNG observations of PSR J2339–0533 (hereafter J2339). It was initially identified as a candidate MSP in a 4.6 h orbit around a ∼0.3 M⊙ companion based on its gamma-ray, X-ray, and optical properties (Romani & Shaw 2011; Kong et al. 2012); the detection of 2.8 ms radio and gamma-ray pulsations later confirmed its nature (Ray et al. 2020, and references therein). Its radio emission is visible only near inferior conjunction, likely due to obscuration by intra-binary ionised material, as is often observed in redback systems (Archibald et al. 2009). The brightness of the optical counterpart varies from mg = 18 to 23 across the orbit (Romani & Shaw 2011; Yatsu et al. 2015; Kandel et al. 2020).
2. Observations and data analysis
SiFAP2, a non-imaging fast photometer (Ghedina et al. 2018), observed J2339 on August 10–12, 2021, for an exposure of 16.9 ks (W1 in the following) and on August 26–27, 2022, for 43.2 ks (W2). The observations were in white light (320–900 nm), with response peaking at ≃450 nm. The two SiFAP2 detectors recorded with an 8 ns resolution the times of arrival of individual photons coming from a field of view of 7 × 7 arcsec2 around the source position, as well as in a source-free region 4.2 arcmin away from the source to measure the sky contribution. During W1, we estimated the background close to the source by tilting the pointing direction of the telescope a few times by ∼20 arcsec for ∼100 s (so-called nodding). The count rate observed by the two detectors during these intervals differed by up to ≈4000 s−1 (see Fig. A.1), likely due to spatial variations in the sky background. To produce the background-subtracted light curves shown in the left panel of Fig. 1, we rescaled the sky count rate by a factor k = 1.36 to match the rate of the other detector during nodding intervals (i.e. when it was off-source; see Appendix A). During W1, the count rate peaks when the pulsar is close to the inferior conjunction (ϕorb ≃ 0.75) of its 4.6 h binary period, resembling the modulation previously observed from the source with maxima at mV ≃ 18.25 mag (Romani & Shaw 2011; Yatsu et al. 2015; Kandel et al. 2020). According to the calibration curve1, SiFAP2 is expected to record (3.9 ± 1.1)×103 s−1 from a star at that magnitude, in reasonable agreement with the observed values. Nodding was not performed during W2, preventing us from accurately determining the background close to the source. We rescaled the sky count rate by the same amount used in W1, obtaining the curves shown in the right panels of Fig. 1. Regardless of the uncertain background subtraction (see Figs. A.2 and A.3), the flux does not show the same variability as in W1. An erratic behaviour has also been reported in observations of a black widow pulsar (Romani & Shaw 2011).
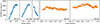 |
Fig. 1. SiFAP2 net light curves of J2339 in the different nights (labelled Ni) of the two Wi observing campaigns (see Appendix A for details on the background estimation) and binned at 50 s. We evaluated the orbital phase with the solution from Table 1. |
We searched SiFAP2 data for a coherent signal at the spin frequency of J2339, first correcting the photons’ arrival times to the Solar System barycentre with DE405 ephemerides. To further account for the delays introduced by the pulsar binary motion, determining the pulsar ephemeris close to the observations’ epoch is crucial. Similar to other MSPs in compact binary systems, the orbital period of J2339 varies by ΔPorb ≃ a few × 10−7Porb on timescales of weeks to months, most likely due to companion gravitational mass quadrupole moment changes (Pletsch & Clark 2015). Our SiFAP2 observations span too few orbital cycles to be sensitive to such variations. However, un-modeled variations in the orbital period cause the epoch of passage of the pulsar at the ascending node of the orbit (Tasc) to differ by up to tens of seconds from the value predicted by using a constant orbital period solution determined years earlier. Such variations in Tasc can be larger than what a few orbital-period-long observations are sensitive to (σTasc ≃ 2.5 s; see e.g. Caliandro et al. 2012) and deserve a careful treatment.
To measure the value of Tasc close to W2, on August 30–31, 2022, we observed J2339 for 10 h (two 2.5 h observations each day) with the Ultra-Wide bandwidth Low (UWL) receiver (Hobbs et al. 2020) of the 64 m Murriyang (Parkes) telescope. We split the 0.7–4 GHz bandwidth of the UWL receiver into 1-MHz-wide channels, and we measured the total intensity in search mode by recording 8-bit sampled data every 64 μs. Starting from the publicly available Fermi-Large Area Telescope (LAT) timing solution covering the interval MJD 54682–58826 (Smith et al. 2023, S23 in the following)2, we used the python code SPIDER_TWISTER3, based on PRESTO4 (Ransom 2011) folding routines, to find a local value of Tasc that maximises the signal-to-noise ratio of the folded pulsed profile. After folding the data with the newly found local Tasc, we extracted pulse times of arrival with PRESTO’s routine get-TOAs.py and refined the orbital ephemeris using tempo2 (Hobbs et al. 2006). This allowed us to obtain the parameters listed in Table 1. The green line in Fig. 2 shows the radio pulse profile. The uncertainties in the radio timing parameters are significantly smaller than the frequency resolution afforded by our data, allowing us to perform a single-trial signal search of SiFAP2 W2 data. The narrow peaks observed in the radio and gamma-ray pulse profiles of J2339 and the low duty cycle of optical pulses of rotation-powered pulsars (see e.g. Fig. 15 in Papitto et al. 2019 for the profile of the Crab pulsar) motivated us to epoch-fold the SiFAP2 data using n = 32 phase bins. We obtained the profile plotted with black points in Fig. 2. A single bin-wide peak exceeds the average count rate by ∼4.5 times its uncertainty and anticipates the radio pulse peak by 135 ± 45 μs. Doubling the number of phase bins did not produce a narrower peak. However, with a lower statistical significance, an excess at phases 0.8–0.9 is also seen, simultaneous to the peaks observed by Fermi-LAT at gamma-ray energies.
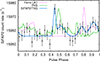 |
Fig. 2. Phase-aligned pulse profiles observed in W2 by SiFAP2 (black points), Parkes (green line), and Fermi-LAT (magenta line; taken from 3PC catalogue, S23, and shifted assuming that the lag with the radio profile is the same as reported there). The normalisation of the radio and gamma-ray profiles is arbitrary. The reference epoch was set to align with the radio peak at phase 0.5. The blue line is a fit to the SiFAP2 pulse profile with four Gaussians added to a constant level. |
To evaluate the statistical significance of the optical pulse, we first used the epoch-folding χ2 test (Leahy et al. 1983; Leahy 1987). Assuming Poissonian counting noise, the epoch-folding statistics follows a χn − 12 distribution when a signal is absent. However, the noise of SiFAP2 is partly correlated. Secondary avalanches triggered by photon detection in silicon photomultiplier detectors generate spurious events that are indistinguishable from astrophysical ones (so-called crosstalk; Gallego et al. 2013; Klanner 2019) and modify the distribution of noise powers. La Placa et al. (2025) show that SiFAP2 noise follows a generalised Poisson distribution with a dispersion index (i.e. the ratio of variance to average) equal to ≃1.15 times what is expected from uncorrelated Poissonian noise. In Appendix B we show that a value of r = 1.16 applies to the data considered here. To evaluate the statistical properties of the observed profile using the usual χn − 12 distribution, we then rescaled by r the observed value of the epoch-folding χ2, obtaining χW22 = 64.4. For n = 32, the probability of observing a value equal to or higher than this in W2 in the absence of a periodic signal is 4.0 × 10⁻⁴, corresponding to a 3.5σ confidence level. We evaluated the (non-background-subtracted) rms amplitude of the signal as Arms = ∑j(Rj/R − 1)2/n = [(χW22 − χnoise2)/Nγ]1/2 = (2.2 ± 0.5)×10−4. Here, R and Rj are the average and j-th bin count rates, respectively, Nγ is the total number of photons, and χnoise2 = (n − 1) is the χ2 expected value in the absence of a signal. The pulse profile is marginally stronger (χsup2 = 57.2;  ) during the interval of orbital phases centred around the pulsar’s superior conjunction (ϕorb = 0 − 0.5) than during the interval centred around the inferior conjunction (ϕorb = 0.5 − 1; χinf2 = 32.1;
  at the 3σ confidence level). However, the shorter exposure accumulated during the latter phase interval prevented us from assessing whether the difference is significant.
We also employed an unbinned statistical test like the H test (de Jager et al. 1989; de Jager & Büsching 2010), obtaining H* = 18.1 for the profile observed during the whole of W2. To evaluate the probability of observing a value equal to or higher than this from data containing only noise, we plotted the distribution of the H values measured at 100 000 independent frequencies close to but not compatible with the known spin frequency (see Fig. B.3), obtaining a probability p(H > H*) = 4.3 × 10⁻³, corresponding to a 2.9σ confidence level.
The absence of nodding during W2 prevented us from reliably measuring the sky contribution. In addition, the optical emission of J2339 is largely dominated by the un-pulsed contribution coming from the irradiated companion star. To estimate the pulsed flux, we then evaluated the pulsed count rate from the average rms amplitude observed during W2, ArmsRW2 = (3.5 ± 0.8) s−1, and used the SiFAP2 calibration curve to obtain the corresponding magnitude,  mag. Based on the absorption column (NH) towards J2339 estimated from HI maps (HI4PI Collaboration 2016), we followed Güver & Özel (2009) to evaluate 0.133(5) mag of expected interstellar extinction in the V band. In addition, the average relative airmass of 1.60 during W2 gave an atmospheric extinction5 of 0.27(1) mag at 450 nm. Assuming a flat spectral distribution, the pulsed magnitude corrected for extinction gives an average pulsed flux of
  erg s−1 cm−2. To check the reliability of estimating the pulsed flux using the calibration curve, we measured the value obtained in the case of the May 23–24, 2017, SiFAP2 high-mode observations of PSR J1023+0038 as
  erg s−1 cm−2. Although slightly smaller, this value is broadly compatible within the uncertainties with that measured by Papitto et al. (2019), (4.1 ± 0.2)×10−14 erg s−1 cm−2, whose high accuracy was thanks to the simultaneous spectroscopic and photometric observations used to calibrate the SiFAP2 flux.
The lack of radio observations close to the epoch of W1 SiFAP2/TNG observations prevented us from phase-connecting the solution obtained in W2 data, and forced us to search for a periodic signal at the pulsar period over a ±15 s range of Tasc values spaced by 0.5 s, around the value predicted using the Tasc value listed in Table 1 and the orbital period given by S23. On the other hand, at the rate estimated by S23, the spin frequency variation from the W2 value is much lower than the frequency resolution. The epoch-folding χ2 reached a maximum of  for TASC = 59437.03632 MJD, which is not significant considering the 61 Tasc trials. The corresponding upper limit at the 3σ confidence level on the rms amplitude is 3.7 × 10⁻⁴, higher than the W2 value. Therefore, we conclude that the lower photon statistics and the lack of a Tasc measurement close to W1 prevented us from reaching a sensitivity high enough to detect a signal with the same amplitude observed in W2. Taking the number of trials into account, the probability of jointly observing χW1, max2 and χW22 in the absence of a signal is 1.8 × 10⁻³.
3. Discussion and conclusions
Based on our analysis of SiFAP2/TNG data taken on August 26–27, 2022, we report the detection of possible optical pulsations from J2339 with a significance ranging between a 2.9 and a 3.5σ confidence level, depending on the adopted test statistics. The observed pulsed magnitude of  mag is very close to the sensitivity limit that SiFAP2/TNG can achieve in a 12-hour-long exposure. If confirmed, the detection of optical pulsations from J2339 would be the first from a rotation-powered MSP. The signal could be observed only after correction of the photon arrival times with the pulsar ephemeris; we argue below that it likely originates close to the neutron star. The signal power decreases below detectability when the epoch of passage at the ascending node is varied by ΔTasc ≃ 1 s from the value measured during radio observations. This translates to an arc-length of 2πa1(ΔTasc/Porb)≈27 km (for i = 57°; Romani & Shaw 2011) around the pulsar position along its orbit. Alternatively, the signal could be produced by the scattering of companion photons by a highly coherent pulsar wind that extends unperturbed up to the intra-binary shock (An et al. 2020; Sim et al. 2024). Unless the emission is strongly beamed towards us, even if scattered photons maintain the phase information on the pulsar spin and are emitted at once by the intra-binary shock, the size of this region cannot be too large. Its displacement along the line of sight cannot exceed c/ν ≈ 860 km; otherwise, the light travel times of the photons from different locations in the reprocessing medium to the observer would not be close enough to maintain coherence. The low duty cycle of the signal (≲1/32) further reduces the maximum displacement to ≈30 km.
So far, observations of five isolated, young rotation-powered pulsars have revealed optical pulsations (see e.g. Mignani 2011, and references therein). These pulsars convert between η ≈ 10−8.5 and 10−5 of their spin-down power into pulsed emission observed in the B band (see the black dots in Fig. 3). The optical emission of these pulsars is commonly ascribed to incoherent synchrotron radiation produced by relativistic particles accelerated in the neutron star magnetosphere (Pacini & Salvati 1983). Despite releasing a spin-down power more than four orders of magnitude weaker than that of the Crab pulsar and PSR J0540–6919, its twin in the Large Magellanic Cloud, the efficiency of J2339 is close to theirs ( ; see the orange dot in Fig. 3), which suggests the same emission process. The observed efficiency is also of the same order as the upper limit set by Strader et al. (2016) for PSR J0337+1715, an MSP in a hierarchical triple system with two white dwarfs. On the other hand, the transitional MSP PSR J1023+0038 (Ambrosino et al. 2017) and the accreting MSP SAX J1808.4–3658 (Ambrosino et al. 2021) are ≈50 − 100 times more efficient, suggesting that an accretion disk around the neutron star may be crucial to increasing particle acceleration, as discussed in Papitto et al. (2019) and Veledina et al. (2019).
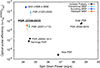 |
Fig. 3. Ratio of the pulsed B (λeff = 433 nm, Weff = 90 nm) luminosity to the spin-down power for J2339 (orange dot) and the sample of detected optical pulsars. The data are from Ambrosino et al. (2017, see Fig. 3, Supplementary Table 1, and references therein), Papitto et al. (2019), and Ambrosino et al. (2021). |
The proposed optical pulsations from a redback rotation-powered MSP lend further support to the idea that fast-rotating pulsars accelerate particles with high efficiency. In addition, the observations discussed here allow us to gauge the sensitivity requirement to search for signals from similar systems. The strength of the signal we report is just above the sensitivity that can be reached during two consecutive nights of observations with a ∼4 m class telescope. Strikingly, the signal was observed when the source optical emission did not show the typical orbital modulation but rather flared close to the maximum magnitude reported for the source. Future quasi-simultaneous observations with radio and possibly even larger optical facilities will be key to increasing the significance of the detection and testing whether the pulsation strength is related to the overall variability properties of the optical light curve.
Data availability
The SiFAP2 data that support the findings of this study are available in figshare with the identifier doi:https://doi.org/10.6084/m9.figshare.30383995.
Acknowledgments
This work was supported by INAF (Research Grant FANS and PULSE-X, PI: Papitto), the Italian Ministry of University and Research (PRIN MUR 2020, Grant 2020BRP57Z, GEMS, PI: Astone), and Fondazione Cariplo/Cassa Depositi e Prestiti (Grant 2023-2560, PI: Papitto). Murriyang, CSIRO’s Parkes radio telescope, is part of the Australia Telescope National Facility (https://ror.org/05qajvd42) which is funded by the Australian Government for operation as a National Facility managed by CSIRO. We acknowledge the Wiradjuri people as the Traditional Owners of the Observatory site.
References
- Abdo, A. A., Ackermann, M., Ajello, M., et al. 2009, Science, 325, 848 [NASA ADS] [CrossRef] [Google Scholar]
- Alpar, M. A., Cheng, A. F., Ruderman, M. A., & Shaham, J. 1982, Nature, 300, 728 [NASA ADS] [CrossRef] [Google Scholar]
- Ambrosino, F., Papitto, A., Stella, L., et al. 2017, Nat. Astron., 1, 854 [NASA ADS] [CrossRef] [Google Scholar]
- Ambrosino, F., Miraval Zanon, A., Papitto, A., et al. 2021, Nat. Astron., 5, 552 [NASA ADS] [CrossRef] [Google Scholar]
- An, H., Romani, R. W., Kerr, M., & Fermi-LAT Collaboration 2020, ApJ, 897, 52 [NASA ADS] [CrossRef] [Google Scholar]
- Archibald, A. M., Stairs, I. H., Ransom, S. M., et al. 2009, Science, 324, 1411 [Google Scholar]
- Backer, D. C., Kulkarni, S. R., Heiles, C., Davis, M. M., & Goss, W. M. 1982, Nature, 300, 615 [NASA ADS] [CrossRef] [Google Scholar]
- Caliandro, G. A., Torres, D. F., & Rea, N. 2012, MNRAS, 427, 2251 [NASA ADS] [CrossRef] [Google Scholar]
- de Jager, O. C., & Büsching, I. 2010, A&A, 517, L9 [NASA ADS] [CrossRef] [EDP Sciences] [Google Scholar]
- de Jager, O. C., Raubenheimer, B. C., & Swanepoel, J. W. H. 1989, A&A, 221, 180 [NASA ADS] [Google Scholar]
- Gallego, L., Rosado, J., Blanco, F., & Arqueros, F. 2013, J. Instrum., 8, P05010 [Google Scholar]
- Ghedina, A., Leone, F., Ambrosino, F., et al. 2018, SPIE Conf. Ser., 10702, 107025Q [NASA ADS] [Google Scholar]
- Güver, T., & Özel, F. 2009, MNRAS, 400, 2050 [Google Scholar]
- HI4PI Collaboration (Ben Bekhti, N., et al.) 2016, A&A, 594, A116 [NASA ADS] [CrossRef] [EDP Sciences] [Google Scholar]
- Hobbs, G. B., Edwards, R. T., & Manchester, R. N. 2006, MNRAS, 369, 655 [Google Scholar]
- Hobbs, G., Manchester, R. N., & Dunning, A. 2020, PASA, 37, e012 [NASA ADS] [CrossRef] [Google Scholar]
- Illiano, G., Papitto, A., Ambrosino, F., et al. 2023, A&A, 669, A26 [NASA ADS] [CrossRef] [EDP Sciences] [Google Scholar]
- Kandel, D., Romani, R. W., Filippenko, A. V., Brink, T. G., & Zheng, W. 2020, ApJ, 903, 39 [NASA ADS] [CrossRef] [Google Scholar]
- Karpov, S., Beskin, G., Plokhotnichenko, V., Shibanov, Y., & Zyuzin, D. 2019, Astron. Nachr., 340, 607 [NASA ADS] [CrossRef] [Google Scholar]
- Klanner, R. 2019, Nucl. Instrum. Methods Phys. Res. A, 926, 36 [Google Scholar]
- Kong, A. K. H., Huang, R. H. H., Cheng, K. S., et al. 2012, ApJ, 747, L3 [Google Scholar]
- La Placa, R., Papitto, A., Illiano, G., et al. 2025, A&A, submitted [arXiv:2508.04873] [Google Scholar]
- Leahy, D. A. 1987, A&A, 180, 275 [NASA ADS] [Google Scholar]
- Leahy, D. A., Elsner, R. F., & Weisskopf, M. C. 1983, ApJ, 272, 256 [Google Scholar]
- Mignani, R. P. 2011, Adv. Space Res., 47, 1281 [NASA ADS] [CrossRef] [Google Scholar]
- Pacini, F., & Salvati, M. 1983, ApJ, 274, 369 [NASA ADS] [CrossRef] [Google Scholar]
- Papitto, A., Ferrigno, C., Bozzo, E., et al. 2013, Nature, 501, 517 [NASA ADS] [CrossRef] [Google Scholar]
- Papitto, A., Ambrosino, F., Stella, L., et al. 2019, ApJ, 882, 104 [NASA ADS] [CrossRef] [Google Scholar]
- Pletsch, H. J., & Clark, C. J. 2015, ApJ, 807, 18 [Google Scholar]
- Ransom, S. 2011, Astrophysics Source Code Library [record ascl:1107.017] [Google Scholar]
- Ray, P. S., Polisensky, E., Parkinson, P. S., et al. 2020, RNAAS, 4, 37 [Google Scholar]
- Romani, R. W., & Shaw, M. S. 2011, ApJ, 743, L26 [CrossRef] [Google Scholar]
- Sim, M., An, H., & Wadiasingh, Z. 2024, ApJ, 964, 109 [NASA ADS] [CrossRef] [Google Scholar]
- Smith, D. A., Abdollahi, S., Ajello, M., et al. 2023, ApJ, 958, 191 [NASA ADS] [CrossRef] [Google Scholar]
- Strader, M. J., Archibald, A. M., Meeker, S. R., et al. 2016, MNRAS, 459, 427 [NASA ADS] [CrossRef] [Google Scholar]
- Veledina, A., Nättilä, J., & Beloborodov, A. M. 2019, ApJ, 884, 144 [CrossRef] [Google Scholar]
- Wijnands, R., & van der Klis, M. 1998, Nature, 394, 344 [CrossRef] [Google Scholar]
- Yatsu, Y., Kataoka, J., Takahashi, Y., et al. 2015, ApJ, 802, 84 [Google Scholar]
- Zampieri, L., Burtovoi, A., Fiori, M., et al. 2019, MNRAS, 485, L109 [NASA ADS] [CrossRef] [Google Scholar]
Appendix A: SiFAP2 light curves of J2339
The W1 campaign took place on August 10-12, 2021, over three nights labelled N1, N2, and N3, respectively. Figure A.1 shows the light curves observed by the on-source (blue points) and sky (grey points) detectors of SiFAP2, after correction of sporadic dark rate variations due to malfunction of the double-stage thermoelectrical Peltier cooling device and removal of short excesses likely caused by meteors, low-Earth orbit satellites and/or cosmic ray strikes. The different count rate observed by the two detectors during the nodding intervals (marked by vertical dashed lines in Fig. A.1) clearly indicates that the flux observed by the sky detector is lower by ≈4000 s−1 than the background contribution affecting the on-source detector. To estimate the latter, we then rescaled the sky detector light curves observed during the three nights by a common factor k = 1.36 to match the on-source detector rate recorded during the nodding intervals, obtaining the points plotted with orange symbols in Fig. A.1. We then subtracted this rescaled background from the on-source light curve to get the net light curves shown in the left panels of Fig. 1. We note that different atmospheric and sky illumination conditions are a likely explanation for the night-to-night variability of the overall count rates observed.
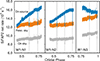 |
Fig. A.1. Light curves observed by the on-source (blue points) and sky (grey points) detectors of SiFAP2 during the W1 campaign, plotted in 1-second-long bins. Vertical dashed lines mark 100-second-long nodding intervals. Orange points indicate the sky detector light curve rescaled by a factor k = 1.36 required to match the rate observed by the on-source detector during nodding intervals. |
The W2 campaign took place on August 26–27, 2022 and the two nights are labelled as N1 and N2, respectively. Figure A.2 shows the on-source (blue symbols) and the sky (grey symbols) count rates observed during W2. Figure A.3 shows the ratio between the on-source and the sky detector. Nodding was not executed during these observations due to technical issues. We then rescaled the sky light curve by the same factor k = 1.36 determined during the W1 campaign and obtained the light curve plotted with orange points, which was then subtracted from the on-source detector curve to obtain the net light curves plotted in the right panels of Fig. 1. This background subtraction procedure is not optimal; a few features of the sky background curves (e.g. the peak around phase ∼0 in W2-N1 and the dip at phase ∼1 in W2-N2; see Fig. A.2) are not completely removed from the net curve shown in Fig. 1, whereas they are less evident from the curve of the ratio between the on-source and the sky rates (see Fig. A.3).
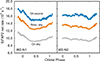 |
Fig. A.2. Light curves observed by the on-source (dark blue points) and sky (green points) detector of SiFAP2 during the W2 campaign plotted in 50-second-long bins. Light blue points indicate the sky detector light curve rescaled by a factor k = 1.36, as determined during the W1 campaign. |
 |
Fig. A.3. Ratio between the on-source and the sky detector count rates observed during the W2 campaign. |
Appendix B: Noise distribution of SiFAP2 data
To study the distribution of noise powers and determine the false alarm probability of the signal observed in SiFAP2 W2 data, we performed 100,000 epoch folding trials using n = 32 phase bins at periods evenly spaced at the independent Fourier resolution, and close to, but not overlapping with, the known period of J2339. Grey boxes in Figs. B.1 and B.2 show the normalised distribution and the cumulative probability of the observed χtr2 values. Clearly, they do not follow the expected probability density and complementary cumulative distribution function for a χn − 12 distribution for n = 32 (overplotted using black lines). The expected complementary cumulative distribution function for such a distribution, 1 − P(n/2, x/2), with P(s, t) the regularised lower-incomplete gamma function, best fits the observed data when the χtr2 values are rescaled by a factor r = 1.16 (see the blue boxes in both figures). This factor is the total dispersion index of the distribution, i.e. the ratio between the observed variance of the distribution and its mean (n − 1, in this case). La Placa et al. (2025) analysed a broader sample of observed SiFAP2 counting distributions to quantify the effect of crosstalk and found similar values. Rescaling the epoch folding χ2 obtained folding W2 data around the timing solution of the pulsar by this factor gave the values of χ2 quoted in the text. For n = 32, the rescaled value obtained in W2, χW22 = 64.4, has a probability of p(χ2 ≥ χW22) = 4.0 × 10⁻⁴ to be exceeded by noise. For comparison, the rescaled χtr2 observed during the 100,000 trials at periods not overlapping with the pulsar period exceeded χW2 for a fraction of  of the total number of trials, in accordance with the value derived above.
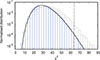 |
Fig. B.1. Distribution of the observed density of χtr2 values observed epoch folding SiFAP2 W2 data around 100,000 trial periods close but not overlapping with the pulsar period (grey boxes). Blue boxes show the distribution of χ2 values rescaled by r = 1.16, and the solid black line the χn − 12 probability density function for n = 32. The vertical dashed line marks the rescaled value of χW22 = 64.4. |
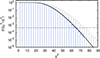 |
Fig. B.2. Complementary cumulative distribution of the χtr2 values obtained by epoch-folding-searching W2 data at 100,000 independent trial periods (grey boxes; see the main text for details). Blue boxes indicate the distribution obtained after rescaling the χ2 values by r = 1.16. The expected χ2 tail distribution for n = 32 is overplotted as a black line. The dashed horizontal line indicates the false alarm probability of the χW22 = 64.4 value observed in SiFAP2 W2 data. |
Similarly, to evaluate the false alarm probability of an H test in SiFAP2 W2 data, we evaluated the H statistics for the same 100,000 independent periods considered above. Figure B.3 shows the complementary cumulative distribution of the observed Htr values. The distribution is best fitted by a function p(Htr > H) = exp( − B ⋅ H) with B = −0.30. This distribution is flatter than the expected distribution when the noise is uncorrelated (B = 0.4 de Jager & Büsching 2010), indicating how crosstalk slightly decreases SiFAP2 sensitivity. The false alarm probability of observing a value equal to, or higher than, H* = 18.1 (as for SiFAP2 W2 data; see Sec. 2) is 4.3 × 10⁻⁴. For comparison, the Htr exceeded H*, (4.2 ± 0.2)×10−3 times the total number of trials.
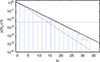 |
Fig. B.3. Complementary cumulative distribution of the Htr values obtained by performing an H test on W2 data at 100,000 independent trial periods (see the main text for details). The solid black and grey lines indicate the best-fit function of the observed distribution, p(Htr > H) = exp( − B ⋅ H) for B = 0.3, and the relation expected if the noise is uncorrelated (B = 0.4; de Jager & Büsching 2010), respectively. The horizontal dashed line marks the false alarm probability of the H* = 18.1 value observed in SiFAP2 W2 data. |
All Tables
All Figures
|
Fig. 1. SiFAP2 net light curves of J2339 in the different nights (labelled Ni) of the two Wi observing campaigns (see Appendix A for details on the background estimation) and binned at 50 s. We evaluated the orbital phase with the solution from Table 1. |
| In the text | |
|
Fig. 2. Phase-aligned pulse profiles observed in W2 by SiFAP2 (black points), Parkes (green line), and Fermi-LAT (magenta line; taken from 3PC catalogue, S23, and shifted assuming that the lag with the radio profile is the same as reported there). The normalisation of the radio and gamma-ray profiles is arbitrary. The reference epoch was set to align with the radio peak at phase 0.5. The blue line is a fit to the SiFAP2 pulse profile with four Gaussians added to a constant level. |
| In the text | |
|
Fig. 3. Ratio of the pulsed B (λeff = 433 nm, Weff = 90 nm) luminosity to the spin-down power for J2339 (orange dot) and the sample of detected optical pulsars. The data are from Ambrosino et al. (2017, see Fig. 3, Supplementary Table 1, and references therein), Papitto et al. (2019), and Ambrosino et al. (2021). |
| In the text | |
|
Fig. A.1. Light curves observed by the on-source (blue points) and sky (grey points) detectors of SiFAP2 during the W1 campaign, plotted in 1-second-long bins. Vertical dashed lines mark 100-second-long nodding intervals. Orange points indicate the sky detector light curve rescaled by a factor k = 1.36 required to match the rate observed by the on-source detector during nodding intervals. |
| In the text | |
|
Fig. A.2. Light curves observed by the on-source (dark blue points) and sky (green points) detector of SiFAP2 during the W2 campaign plotted in 50-second-long bins. Light blue points indicate the sky detector light curve rescaled by a factor k = 1.36, as determined during the W1 campaign. |
| In the text | |
|
Fig. A.3. Ratio between the on-source and the sky detector count rates observed during the W2 campaign. |
| In the text | |
|
Fig. B.1. Distribution of the observed density of χtr2 values observed epoch folding SiFAP2 W2 data around 100,000 trial periods close but not overlapping with the pulsar period (grey boxes). Blue boxes show the distribution of χ2 values rescaled by r = 1.16, and the solid black line the χn − 12 probability density function for n = 32. The vertical dashed line marks the rescaled value of χW22 = 64.4. |
| In the text | |
|
Fig. B.2. Complementary cumulative distribution of the χtr2 values obtained by epoch-folding-searching W2 data at 100,000 independent trial periods (grey boxes; see the main text for details). Blue boxes indicate the distribution obtained after rescaling the χ2 values by r = 1.16. The expected χ2 tail distribution for n = 32 is overplotted as a black line. The dashed horizontal line indicates the false alarm probability of the χW22 = 64.4 value observed in SiFAP2 W2 data. |
| In the text | |
|
Fig. B.3. Complementary cumulative distribution of the Htr values obtained by performing an H test on W2 data at 100,000 independent trial periods (see the main text for details). The solid black and grey lines indicate the best-fit function of the observed distribution, p(Htr > H) = exp( − B ⋅ H) for B = 0.3, and the relation expected if the noise is uncorrelated (B = 0.4; de Jager & Büsching 2010), respectively. The horizontal dashed line marks the false alarm probability of the H* = 18.1 value observed in SiFAP2 W2 data. |
| In the text | |
Current usage metrics show cumulative count of Article Views (full-text article views including HTML views, PDF and ePub downloads, according to the available data) and Abstracts Views on Vision4Press platform.
Data correspond to usage on the plateform after 2015. The current usage metrics is available 48-96 hours after online publication and is updated daily on week days.
Initial download of the metrics may take a while.