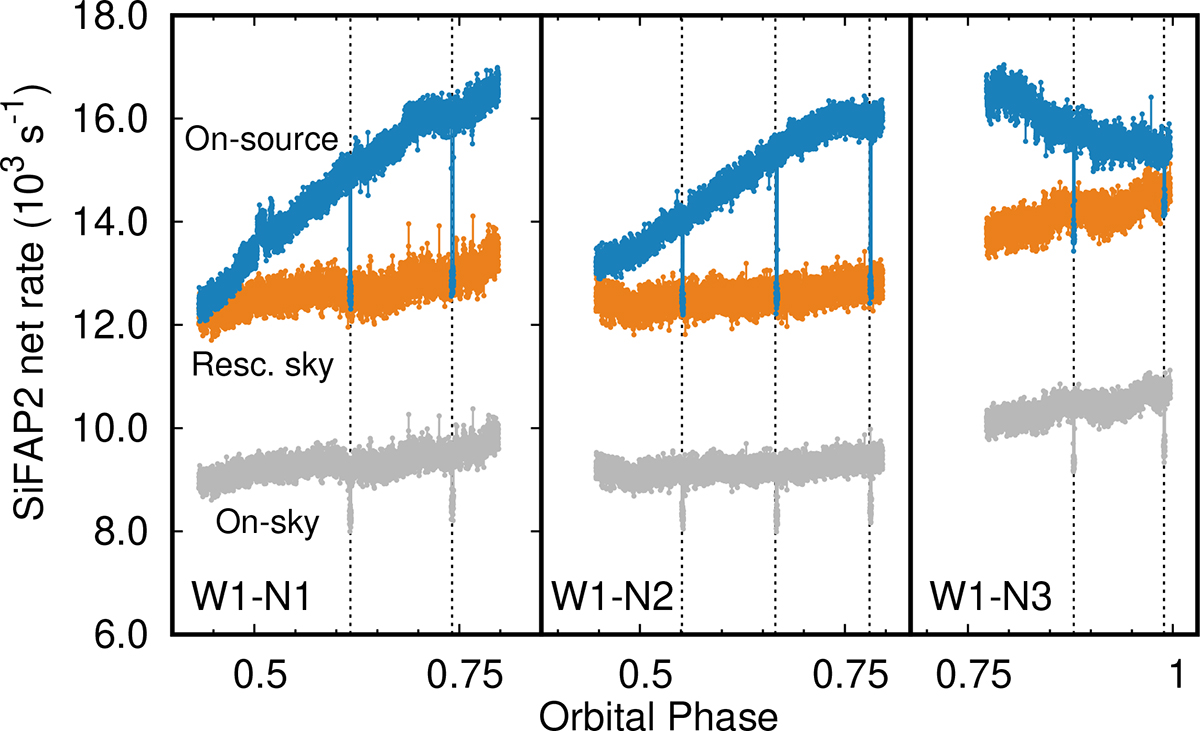
Fig. A.1.
Download original image
Light curves observed by the on-source (blue points) and sky (grey points) detectors of SiFAP2 during the W1 campaign, plotted in 1-second-long bins. Vertical dashed lines mark 100-second-long nodding intervals. Orange points indicate the sky detector light curve rescaled by a factor k = 1.36 required to match the rate observed by the on-source detector during nodding intervals.
Current usage metrics show cumulative count of Article Views (full-text article views including HTML views, PDF and ePub downloads, according to the available data) and Abstracts Views on Vision4Press platform.
Data correspond to usage on the plateform after 2015. The current usage metrics is available 48-96 hours after online publication and is updated daily on week days.
Initial download of the metrics may take a while.