Open Access
Fig. A.2.
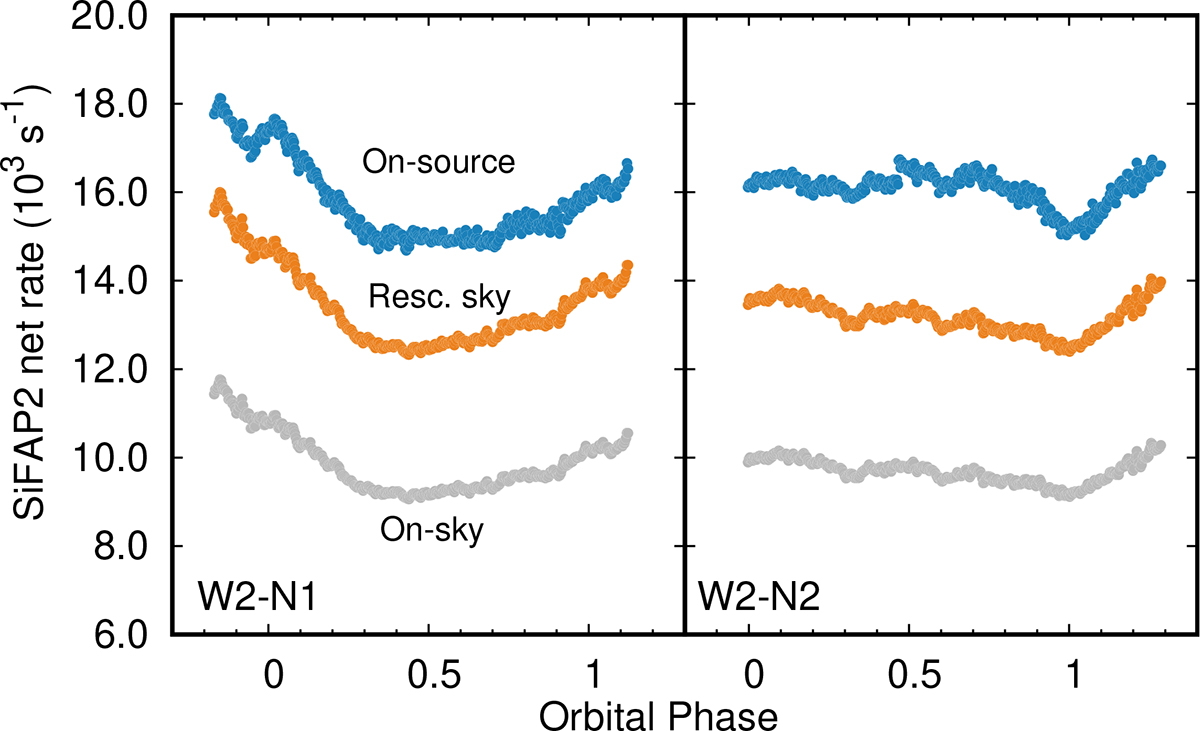
Download original image
Light curves observed by the on-source (dark blue points) and sky (green points) detector of SiFAP2 during the W2 campaign plotted in 50-second-long bins. Light blue points indicate the sky detector light curve rescaled by a factor k = 1.36, as determined during the W1 campaign.
Current usage metrics show cumulative count of Article Views (full-text article views including HTML views, PDF and ePub downloads, according to the available data) and Abstracts Views on Vision4Press platform.
Data correspond to usage on the plateform after 2015. The current usage metrics is available 48-96 hours after online publication and is updated daily on week days.
Initial download of the metrics may take a while.