Fig. B.2.
Download original image
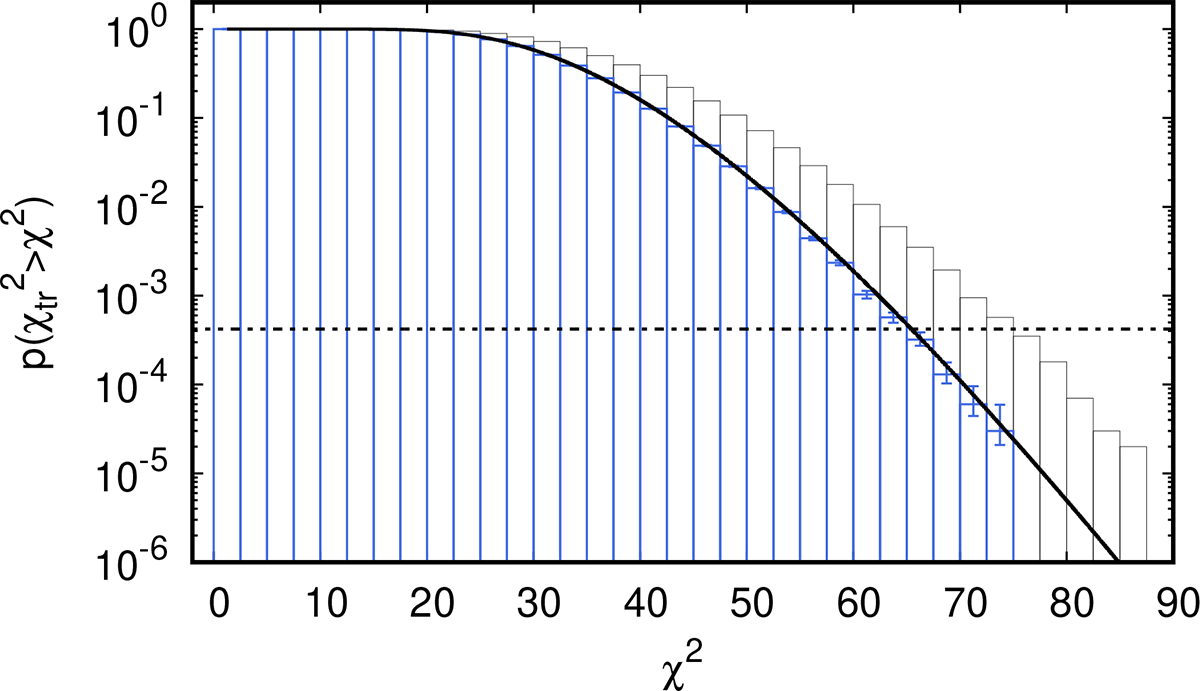
Complementary cumulative distribution of the χtr2 values obtained by epoch-folding-searching W2 data at 100,000 independent trial periods (grey boxes; see the main text for details). Blue boxes indicate the distribution obtained after rescaling the χ2 values by r = 1.16. The expected χ2 tail distribution for n = 32 is overplotted as a black line. The dashed horizontal line indicates the false alarm probability of the χW22 = 64.4 value observed in SiFAP2 W2 data.
Current usage metrics show cumulative count of Article Views (full-text article views including HTML views, PDF and ePub downloads, according to the available data) and Abstracts Views on Vision4Press platform.
Data correspond to usage on the plateform after 2015. The current usage metrics is available 48-96 hours after online publication and is updated daily on week days.
Initial download of the metrics may take a while.