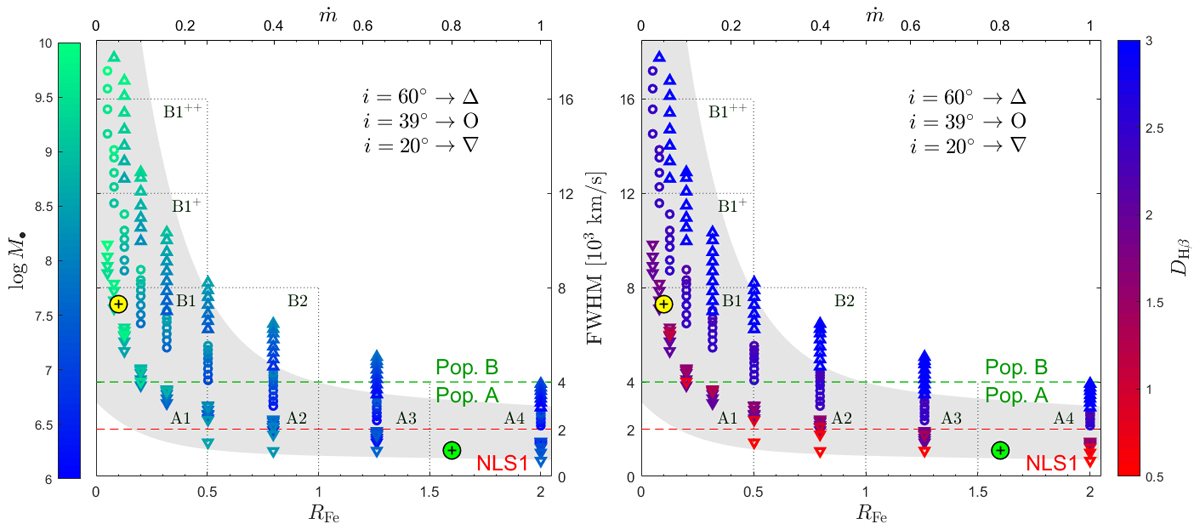
Fig. 1.

Download original image
EV1 expressed with ṁ as the proxy for RFe. Points show FWHMHβ versus ṁ from FRADO-driven BLR models at different inclinations, color coded by (left) log M• and (right) DHβ. The upper and lower horizontal axes correspond to FRADO and observational data (gray-shaded area), respectively, with no scaling relation applied between them. Green and yellow circles (⊕) mark the RFe-based locations of I Zw 1 (Marziani et al. 2021) and NGC 5548 (Du & Wang 2019). The horizontal green dashed line marks the PA-PB boundary, and the region below the red dashed line indicates the location of NLS1 objects.
Current usage metrics show cumulative count of Article Views (full-text article views including HTML views, PDF and ePub downloads, according to the available data) and Abstracts Views on Vision4Press platform.
Data correspond to usage on the plateform after 2015. The current usage metrics is available 48-96 hours after online publication and is updated daily on week days.
Initial download of the metrics may take a while.


