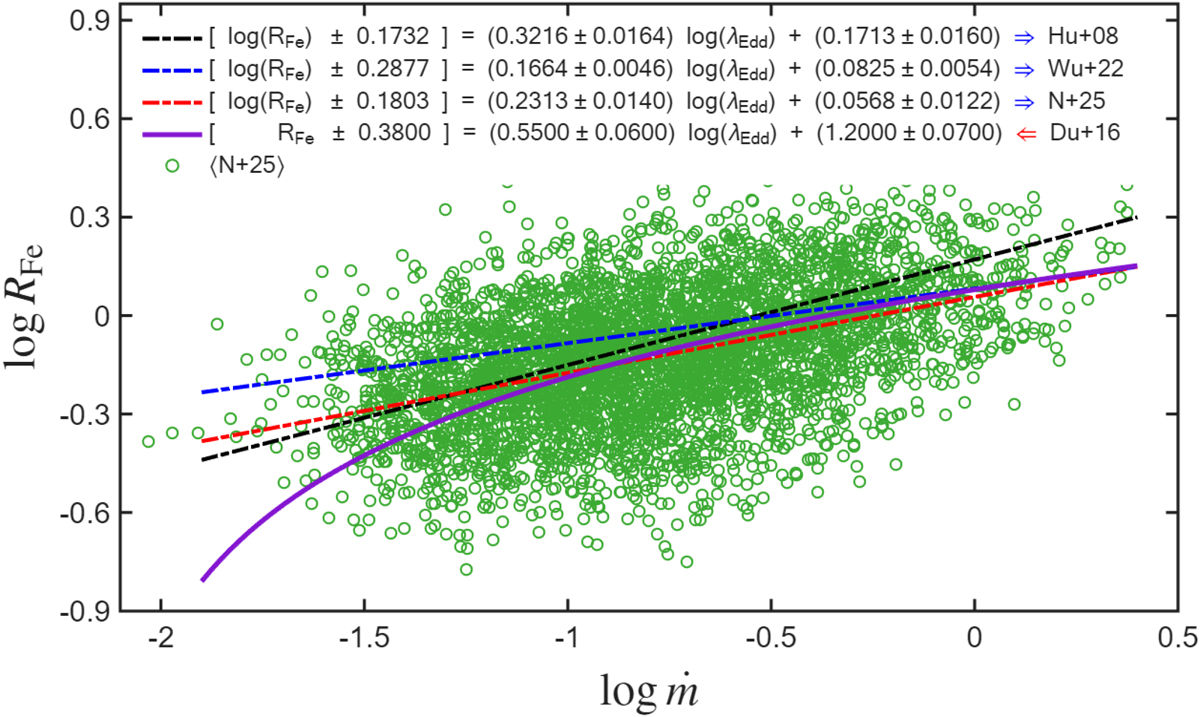
Fig. A.2.
Download original image
Relations between log RFe and log λEdd for three different samples. Green circles show our N+25 reproduced data. Black, blue, and red dashed lines are our best-fit linear regressions to datasets from Hu et al. (2008), Wu & Shen (2022), and N+25, respectively. The purple solid curve is the nonlinear prescription from Du et al. (2016) found based on a sample of 63 RM super-Eddington quasars. Slopes and intercepts are shown with their 95% confidence intervals (∼2σ); numbers in brackets are the RMS scatters of each sample about the respective best-fit lines. We note that λEdd and ṁ are used interchangeably (see Appendix B).
Current usage metrics show cumulative count of Article Views (full-text article views including HTML views, PDF and ePub downloads, according to the available data) and Abstracts Views on Vision4Press platform.
Data correspond to usage on the plateform after 2015. The current usage metrics is available 48-96 hours after online publication and is updated daily on week days.
Initial download of the metrics may take a while.