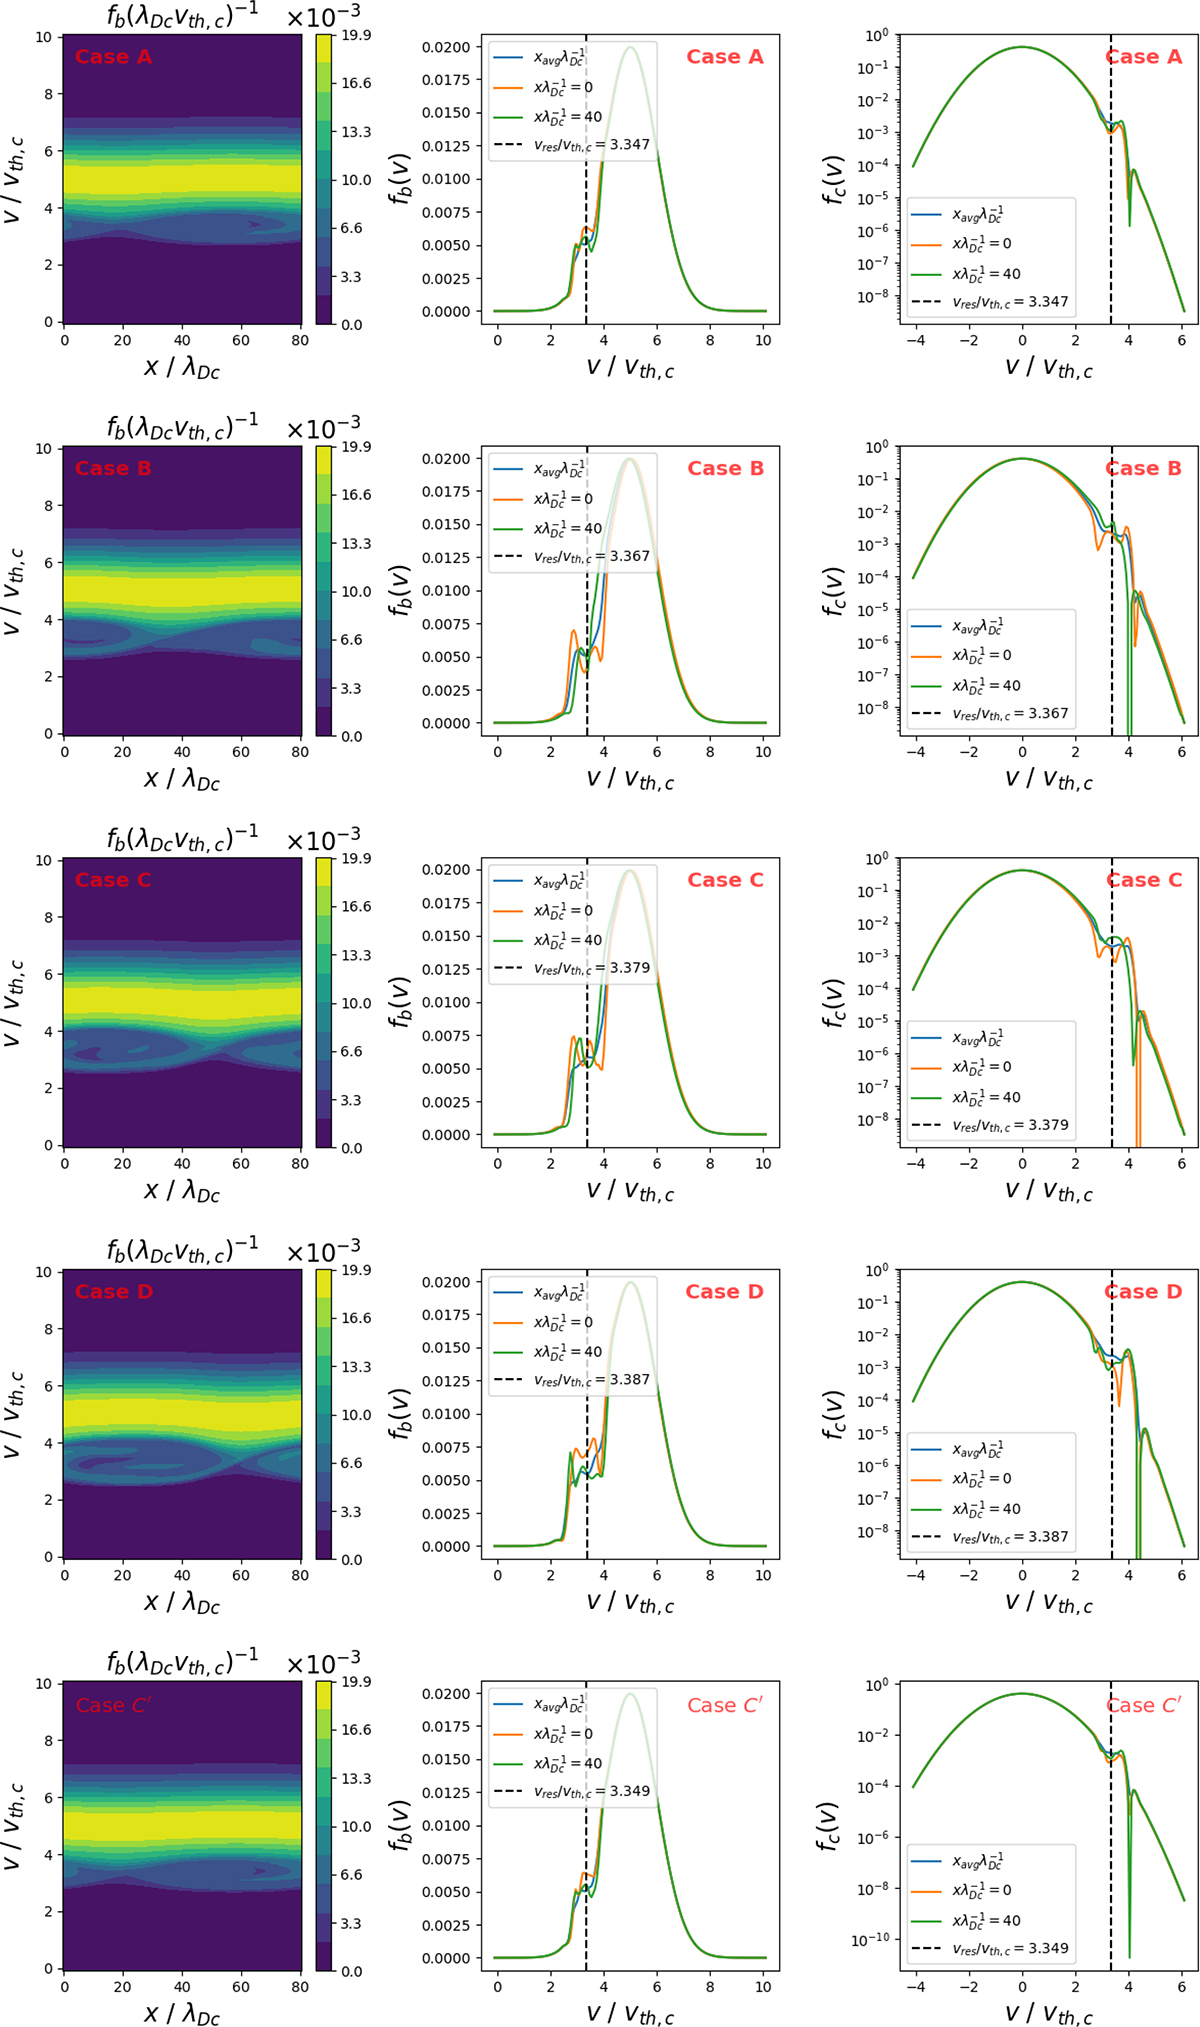
Fig. 9.
Download original image
Snapshots of the core and beam distribution as a function of the strahl’s temperature for the cases listed in Table 2 at time ωpct = 1000, when all simulations are saturated. Left: Beam phase-space distribution. Middle and right: Beam and core velocity distributions, respectively, averaged in x (blue lines), cut at x/λDc = 0 (orange line) and at x/λDc = 40 (green line). The vertical dashed lines indicate the theoretical estimates of the resonant velocity.
Current usage metrics show cumulative count of Article Views (full-text article views including HTML views, PDF and ePub downloads, according to the available data) and Abstracts Views on Vision4Press platform.
Data correspond to usage on the plateform after 2015. The current usage metrics is available 48-96 hours after online publication and is updated daily on week days.
Initial download of the metrics may take a while.