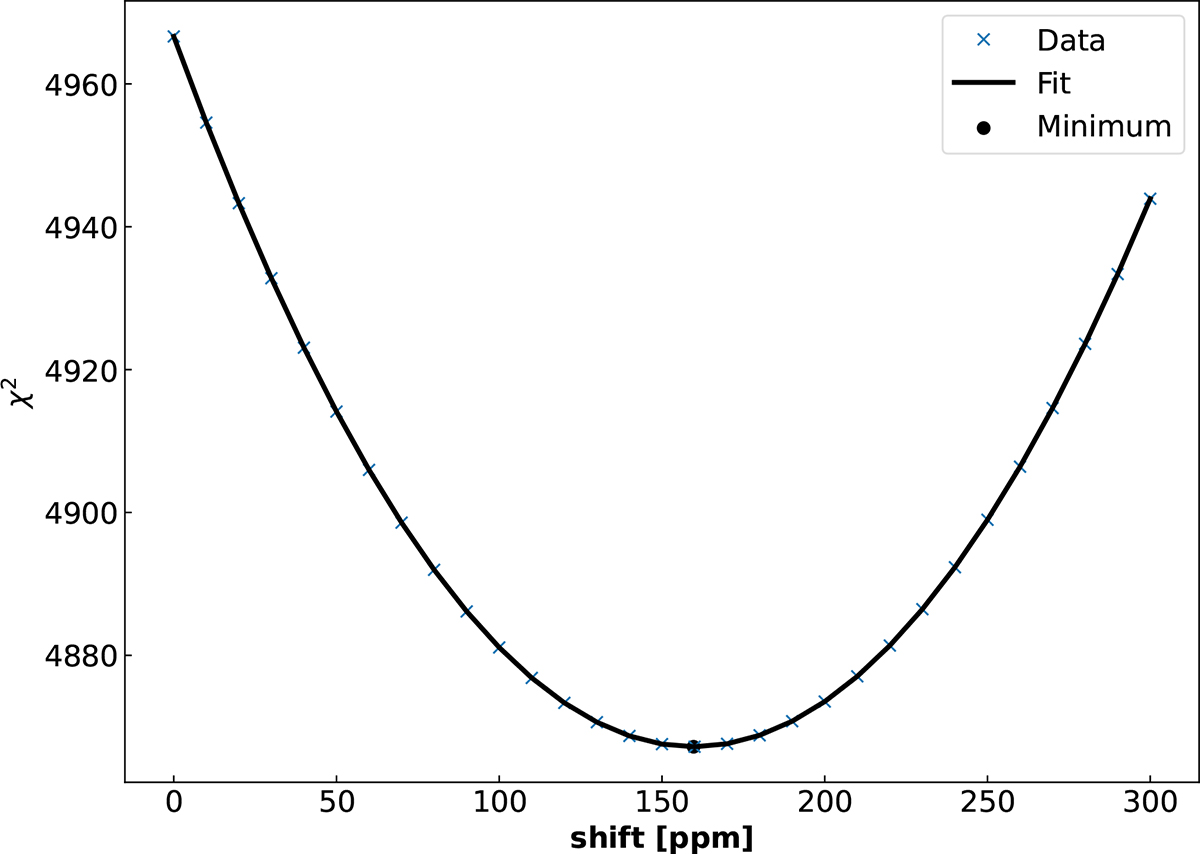
Fig. A.1.
Download original image
χ2 of the best nonequilibrium model from Jaziri et al. (2025), shown as a function of the MIRI LRS wavelength shift and based on the combined JWST observations from NIRISS SOSS, NIRSpec G395H (Madhusudhan et al. 2023), and MIRI LRS (Luque et al. 2025). Blue crosses indicate the computed values, and a second-order polynomial fit is indicated by a solid black line, with its minimum value (160 ppm) marked by a black dot.
Current usage metrics show cumulative count of Article Views (full-text article views including HTML views, PDF and ePub downloads, according to the available data) and Abstracts Views on Vision4Press platform.
Data correspond to usage on the plateform after 2015. The current usage metrics is available 48-96 hours after online publication and is updated daily on week days.
Initial download of the metrics may take a while.